Ethereum’s recent market performance presents a mixed picture. As highlighted by CRYPTOWZRD, an analyst, the cryptocurrency ended the day with indecision, but a bullish turnaround seems plausible. This expectation is partly influenced by the ETH/BTC pair’s behavior. Ethereum’s intraday charts are crucial, especially as the ongoing trade remains secure.
The Ethereum market shows conflicting signals. Both Ethereum and ETH/BTC closed with bearish candles on their Weekly and Monthly charts, while the Daily chart reflects indecision. This divergence highlights the current market uncertainty. For Ethereum to see upward momentum, ETH/BTC must break above 0.0450 BTC. This level is pivotal in driving Ethereum’s price higher.
Ethereum Resilience: Will It Break $2,850 and Reach $3,200?Ethereum is testing a significant daily support level at $2,400. This support is crucial for determining whether Ethereum will experience a bullish shift. If Ethereum manages to hold above this level, it could target $2,750, with the possibility of extending gains to $3,550. This potential upward movement is supported by the technical outlook, which suggests a positive shift if certain conditions are met.
In addition to the price action, the Ethereum market faces potential weekend volatility. Recent intraday choppiness may continue, affecting short-term trading strategies. As the cryptocurrency adjusts to market conditions, volatility could present both challenges and opportunities for traders.
As at press time, the Ethereum price is at $2,521.81, with a 24-hour trading volume of $14,047,399,211. Despite a minor decline of 0.31% in the last 24 hours, the technical indicators offer a mixed view.
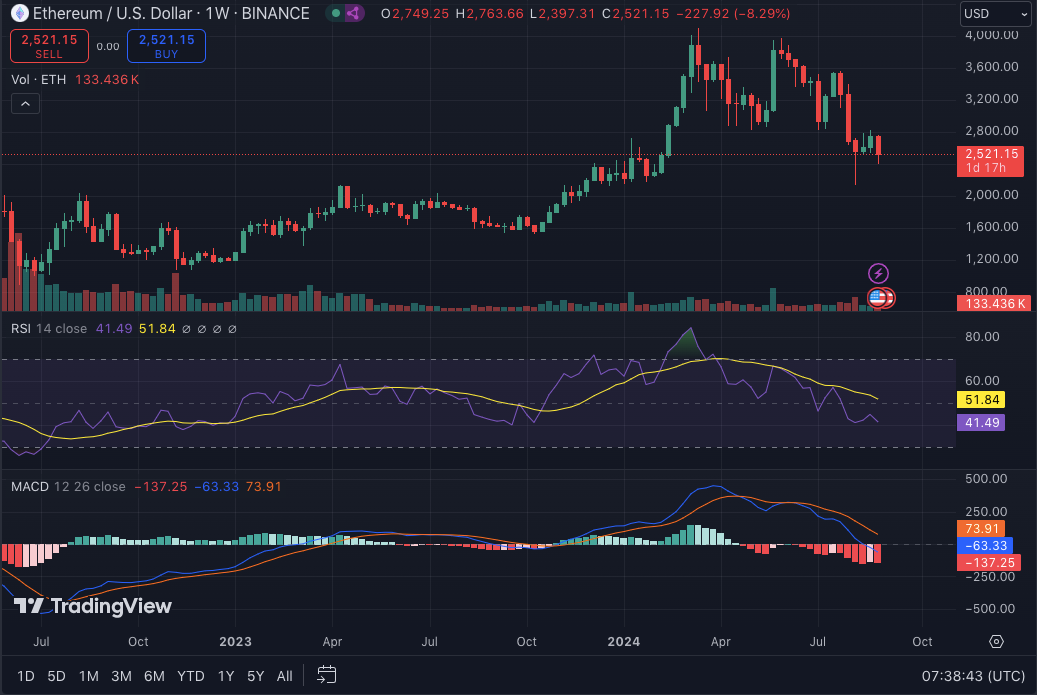
The 1-week Relative Strength Index (RSI) stands at 41.49, suggesting that Ethereum might be approaching oversold conditions. Consequently, there could be room for a price rebound if buying pressure increases. Moreover, the Moving Average Convergence Divergence (MACD) indicates a bullish trend, with the MACD line hovering above the signal line.