


- Bitcoin faces strong resistance at $68K and struggles to sustain above it, indicating seller dominance.
- Despite a price dip below $67K, significant crowd buying interest surged, reflecting FOMO and greed-driven behaviors.
- A short-term bearish trend with reduced volume and slight market cap decline signals cautious trading sentiment.
Bitcoin’s journey has been turbulent recently, marked by significant price fluctuations and notable market reactions. On June 12, Bitcoin experienced a price spike after Senator Elizabeth Warren wrote a letter urging federal regulators to cut rates. However, the enthusiasm was short-lived as the FOMC press release maintained the current rates, causing Bitcoin to drop back to pre-FOMC levels. This volatility has left many traders wondering whether to take profits or hold their positions.
As highlighted by Santiment, a top analytic firm, on June 13, Bitcoin’s price dipped below $67,000, triggering the second-largest surge in crowd-buying interest in two months. This scenario exemplifies the two common market behaviors driven by FOMO (fear of missing out) and greed.
First, when the price rises, traders rush to buy, hoping for continued gains, as seen on May 20th. Second, when the price falls, traders buy the dip, believing it’s an unjustified drop and anticipating a quick recovery.

As of the latest data fetched at the time of writing, Bitcoin is priced at $66,879.60 with a market cap of $1.318 trillion and a 24-hour trading volume of $26.484 billion. The circulating supply stands at 19,711,962 BTC. These figures highlight the immense scale of the Bitcoin market and its significant trading activity.
Analyzing the price movement over a one-day period reveals key support and resistance levels. The $68,000 mark has proven to be a strong resistance, with the price struggling to sustain above this level.
Crypto Market Sees Mixed Trends: Bitcoin Steady Above $67K, Solana and XRP DeclineSimilarly, the $67,500 level has also acted as resistance, indicating seller strength. On the support side, Bitcoin found stability around $66,500, suggesting active buyer interest at this level. Additionally, minor support is observed at nearly $66,700.
The short-term trend appears bearish, characterized by lower highs and lower lows, signaling a downward trajectory. The trading volume has decreased by 26.34% in the past 24 hours, reflecting reduced buying interest and reinforcing the bearish sentiment. Moreover, the market cap has slightly declined by 0.98%, further indicating cautious trading behavior.
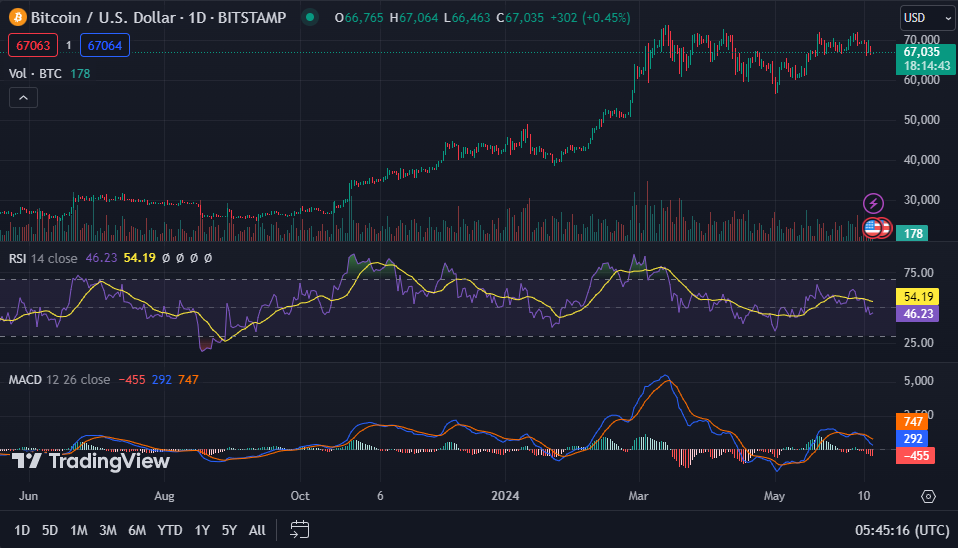
Bitcoin’s 1-day RSI (Relative Strength Index) reads 45.83, indicating a neutral market, neither overbought nor oversold. The MACD (Moving Average Convergence Divergence) trading below the signal line suggests potential downward pressure in the short term.


