
- DOGE’s current support at $0.1000 could stabilize prices, while resistance at $0.1200 remains a critical hurdle.
- High trading volume during price drops suggests robust selling pressure, reinforcing DOGE’s bearish trend.
- RSI at 24.16 signals oversold conditions, hinting at a potential short-term reversal despite ongoing bearish momentum.
Dogecoin (DOGE) has recently exhibited substantial volatility, characterized by pronounced price surges and declines. According to Cheds, an analyst, the cryptocurrency reached a peak near $0.2200 in December 2023, followed by a marked downtrend.
As per Whale Alert data, a blockchain tracker, a notable transfer of 400,000,000 DOGE (equivalent to $41,081,558 USD) from an unknown wallet to Binance has caught the market’s attention, prompting a closer look at the current trends.

Dogecoin’s price is now trading around $0.09718, reflecting a 23.30% decrease in the past 24 hours. The trading volume stands at $1,653,821,872, indicating significant market activity. This level of trading volume, especially during price drops, suggests robust selling pressure. This pattern is confirmed by the volume bars, which show increased activity coinciding with price declines.
Cheds analysis reveals that DOGE’s current support level is around $0.1000, a level that has previously acted as resistance but has now turned into support. This is visually indicated by blue horizontal lines on the chart. In contrast, the immediate resistance is positioned at approximately $0.1200. After a minor recovery, the price encountered rejection at this level, highlighting its significance as a resistance point.
Bitcoin Faces Historic Sell Pressure: Is Now the Time to Buy?In Dogecoin’s chart, the 20-day moving average (MA), indicating short-term trends, has crossed below the 50-day moving average, which represents longer-term trends. This crossover is a clear bearish signal. Additionally, Dogecoin’s price currently remains below these moving averages, confirming the prevailing bearish trend.
Examining the Bollinger Bands, Dogecoin’s price is near the lower band, which suggests that the asset might be oversold in the short term. This positioning could signal a potential short-term bounce as the overall trend remains downward.
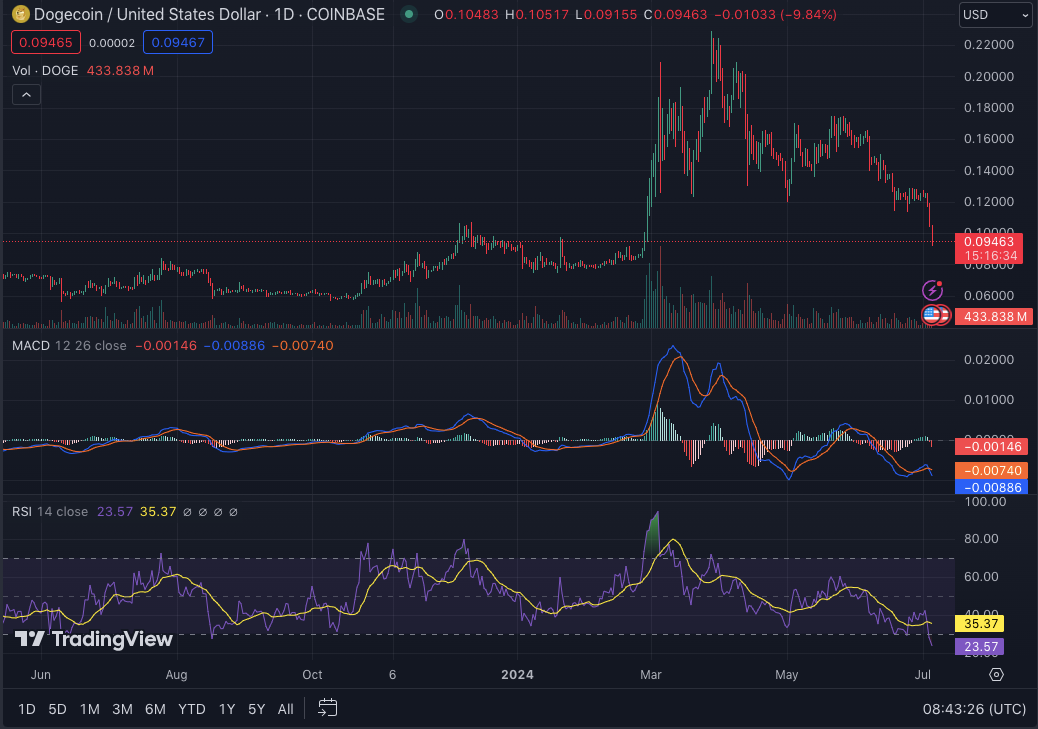
Additionally, the one-day RSI is at 24.16, which indicates oversold conditions and hints at a possible near-term reversal. The one-day MACD trading below the signal line indicates bearish momentum in the short term.