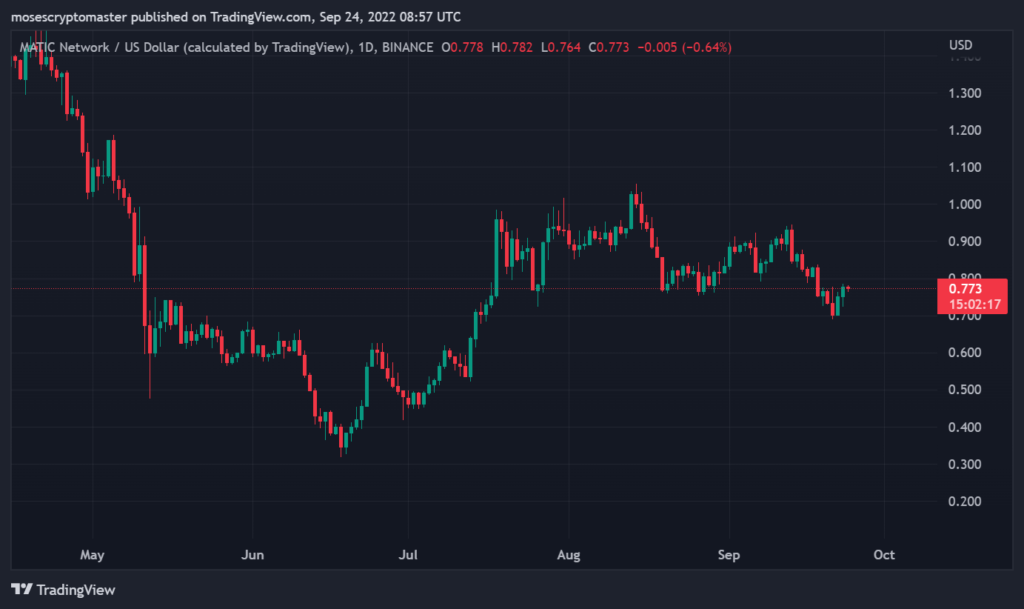
MATIC’s price swept a crucial support level on September 21 after the FOMC meeting, but the dip was bought aggressively near the $0.64 level. The price started a fresh increase after forming a support base near the $0.64 level.
The price tested the 50% Fib retracement level of the upward move from the $0.64 swing low to the $0.75 high, but it found bids near the $0.722 level. There was also a break below the $0.728 level, but the price stayed well above the 100 hourly simple moving average. The price tested the $0.70 level and started a new increase.
The pair could correct lower in the short term, but downsides will likely be limited below $0.70. More importantly, there is a major bullish flag formation with support near $0.729 on the hourly chart of the MATIC/USD pair. The pair will likely continue higher above the $0.832 and $0.850 levels in the near term.
Polygon price analysis for 1-day
On the other hand, if MATIC’s price gets rejected at the range low of $0.758, it will indicate weak buyers a rejection of the bearish impulse. In this case, a move towards the range high is unlikely, and Polygon might even resume the downtrend. In such a case, a move below $0.64 would invalidate the bullish thesis as it would complete a descending triangle pattern on MATIC/USDT 1-day chart.

MATIC‘s price is following a bullish path above $0.729. The next key resistance is near the $0.906 level, followed by $1.050. A proper close above the $1 level could set the pace for a push towards $1.50 in the near term.
A significant support base is forming near the $0.729 level. A downside break below this level may call for $0.70 or lower in the short term. Polygon bulls are likely to defend downsides aggressively near these levels.
MATIC/USD 4-hour price analysis: Latest developments
The 4-hour chart shows that Polygon’s price has stabilized above the $0.70 level, with a bullish breakout pattern forming. The price is now trading near the $0.729 resistance, which is also near the 100 simple moving average.

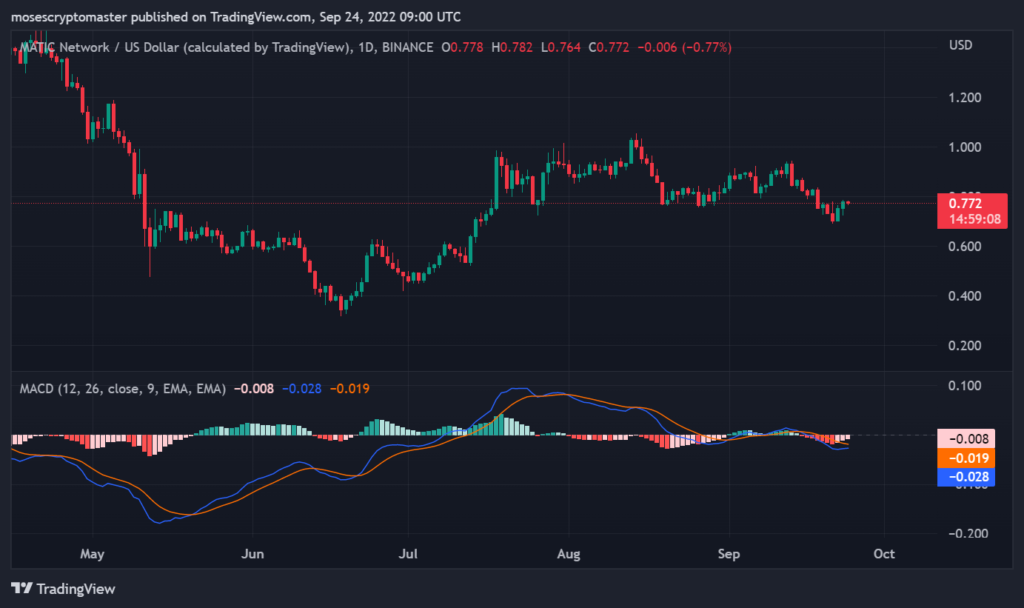
On the 4-hour chart, the Relative Strength Index is holding well above the midline, with no bearish divergence yet to be spotted. The MACD shows sustained bullish momentum as the signal line stays comfortably above the histogram. Lastly, the Average True Range indicator is on a recovery path towards 0.058.
From the topside, a move towards $0.906 is likely in the near term as this level coincides with the 61.8% Fibonacci retracement of the downward move from $1.050 to $0.64. Above this, Polygon could aim for a new all-time high above $1.050 as the bulls remain in full control of the market.
Polygon price analysis: Conclusion
MATIC price looks set to continue its uptrend in the near term with immediate upside targets at $0.95 and $1.050. However, a break below $0.729 could lead to a correction towards the $0.64 support level.


