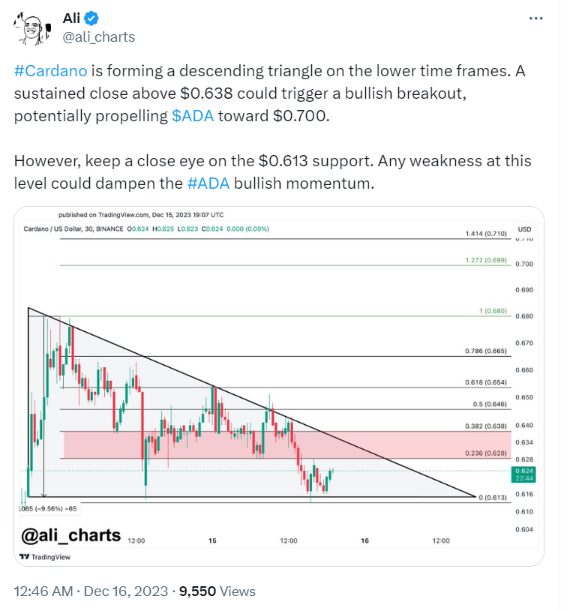
- Cardano (ADA) faces a critical decision point, with the potential for a bullish surge if it holds above $0.638.
- Monitoring the $0.613 support level is crucial, as weakness could dampen ADA’s bullish momentum.
- ADA’s RSI suggests a balanced market, while the MACD provides insights into trend and momentum for traders and investors.
In the volatile world of cryptocurrency, Cardano (ADA) currently stands at a critical juncture, stirring a mix of anxiety and anticipation among traders. Renowned cryptocurrency analyst Ali Martinez has highlighted a significant pattern in ADA’s recent price movements, pointing to a crucial decision point for investors: to buy or to sell.
ADA is experiencing a tense moment, as it teeters on the edge of a key support level. The currency has formed a descending triangle on the thirty-minute chart, a pattern typically seen as bearish. However, Martinez suggested that if ADA maintains a position above $0.638, it could defy expectations and climb to $0.700. This potential for a bullish surge injects a ray of hope amidst the prevailing uncertainty.
However, caution remains paramount. Martinez urged traders to closely monitor the $0.613 support level. Any signs of weakness at this level could significantly “dampen” ADA’s bullish momentum, shifting the market sentiment.

As of today, ADA’s price stands at $0.615633, reflecting a -3.24% decline over the last 24 hours and a -1.10% fall over the past week. With a market cap of $21.52 billion and a circulating supply of 35 billion ADA, the stakes are high.
In analyzing ADA’s price movement, two key indicators provide further insights. The Relative Strength Index (RSI), sitting at around 52.74, indicates a neutral market momentum. An RSI value above 70 signals an overbought condition, while below 30 suggests an oversold market. Hence, ADA’s current RSI suggests a market in balance, with potential for movement in either direction.
Moreover, the Moving Average Convergence Divergence (MACD) offers a glimpse into the trend and momentum. The MACD, shown as a blue line with an orange signal line, is accompanied by a histogram in green and red, indicating the relationship between two moving averages of ADA’s price. This indicator is vital for understanding the market’s direction and strength.
For traders and investors, these are times that require careful analysis and prudent decision-making. While the potential for a bullish breakout exists, the risks of a downturn are equally present. Consequently, staying informed and vigilant is key in navigating the unpredictable waters of the cryptocurrency market.


