XRP has shown notable volatility in recent market developments, as highlighted in EGRAG CRYPTO’s analysis of the XRP/USDT pair, which provides crucial insights. His 4-hour chart reveals significant price fluctuations. Interestingly, the chart’s background features colored zones, each symbolizing different market conditions.
The top blue zone suggests a consolidation phase where prices are stable. Meanwhile, the yellow middle band, indicative of ‘Wicking,’ highlights areas of potential price rejection. The red zone at the bottom signals high volatility or bearish pressure, demanding traders’ caution. These zones are vital for understanding market sentiment.
Price movement analysis shows a recent downward trend. The last candlestick, colored red, indicates a decrease of 0.43% from the previous period. This price action, coupled with a volume of 1.914M, reflects the intensity of trading activity.
Moreover, the chart includes Fibonacci retracement levels. These levels, like 0.236, 0.382, and others, are crucial for predicting support and resistance. Notably, the 1.618 extension level, marked by an arrow, suggests potential future resistance.
Furthermore, a green oval with ‘Zooming IN’ text points to an area of interest. This highlights imminent price movements or critical price actions. The top left corner of Egrag’s chart displays the latest price at 0.5747 USD, a decrease of 2.25%, with a significant trading volume of 7.039M.
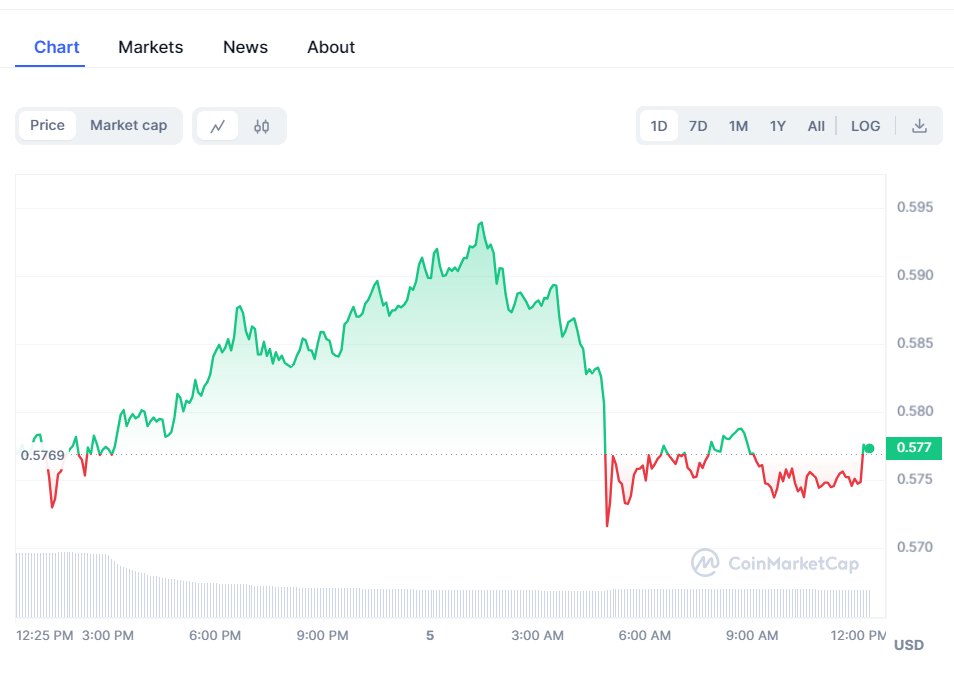
Additionally, CoinMarketCap data confirms this trend. XRP’s current price is $0.574704, marking a 1.31% decline in 24 hours. This aligns with the TradingView weekly chart analysis.
The weekly chart shows a mix of red and green candles. Red candles indicate weeks of price decline, while green candles suggest bullish trends. Below, the volume bars corroborate these movements, with their colors reflecting the closing prices.
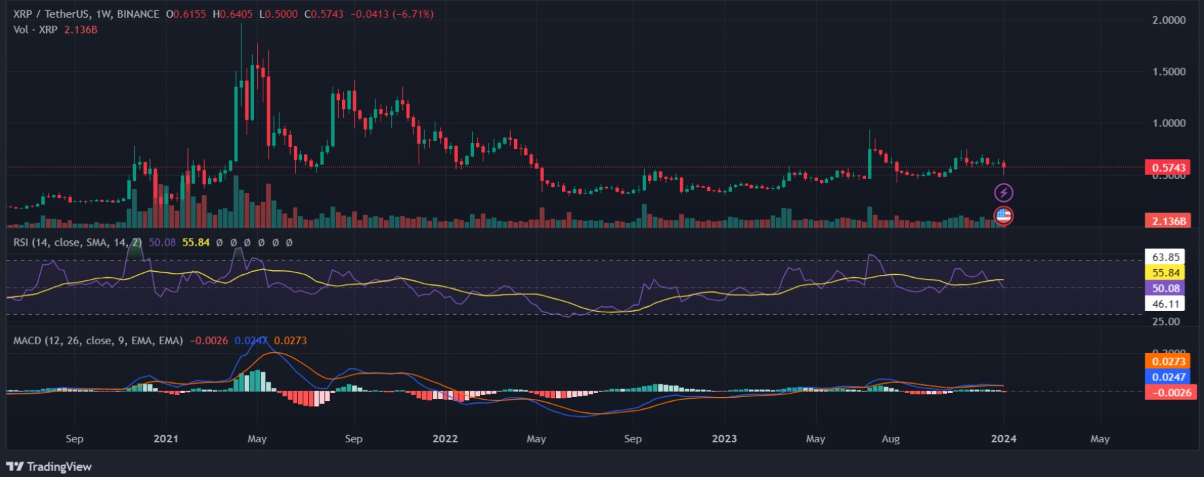
Furthermore, the RSI, a key momentum indicator, is at 55.84. This level suggests a balanced market, neither overbought nor oversold. Simultaneously, the MACD lines, although trending downwards, hint at a possible trend reversal.
XRP’s market position portrays bearish and bullish signals. The technical analysis by EGRAG CRYPTO offers valuable insights for traders. With the RSI and MACD indicating no extreme conditions, the market awaits its next significant move. Hence, investors should closely monitor these indicators for upcoming trends.