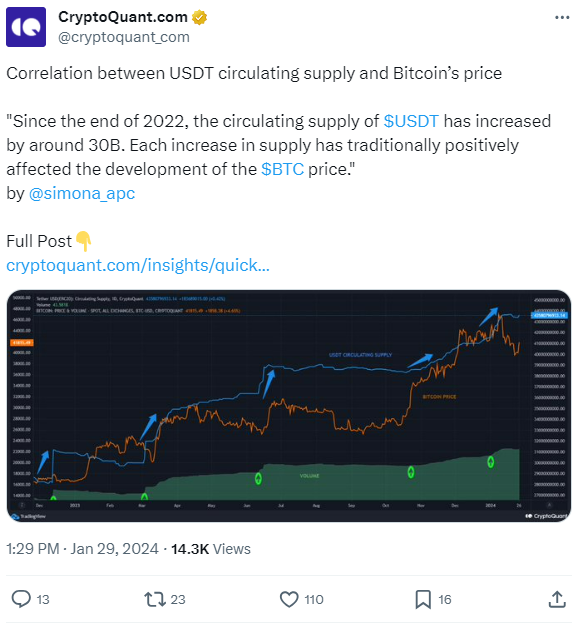
In the digital currency domain, the recent months have painted an intriguing picture of correlation between Tether’s (USDT) circulating supply and Bitcoin’s price trajectory. A meticulous examination of the data from CryptoQuant, an on-chain data and analytics provider, has highlighted a notable trend. As USDT’s supply surged, so too did Bitcoin’s value, suggesting a dance of digits that merits investor attention.
Since the curtain fell on 2022, the circulating supply of Tether has ballooned by approximately 30 billion. Historically, this swelling of USDT’s presence in the market has been a harbinger of a bullish phase for Bitcoin’s price. The pattern is hard to ignore – each significant injection of USDT liquidity appears to usher in a wave of positive price action for Bitcoin.
This phenomenon is not merely a matter of numbers rising in tandem. The relationship speaks to deeper market dynamics. As the supply of USDT expands, it introduces fresh capital into the cryptocurrency ecosystem, potentially spurring investor enthusiasm. This influx of liquidity has coincided with speculative anticipation around a Bitcoin spot Exchange-Traded Fund (ETF) and a general uptick in investor interest. The result is a vivacious market, with volume and vigor increasing in lockstep.
Although there is a strong connection between the amount of USDT available and the price of Bitcoin, it’s important to remember that the crypto market is quite complicated. The synchronous growth patterns offer a compelling narrative. In this system, having liquidity is really important, and Tether’s increasing supply of money could be seen as what keeps Bitcoin going strong.
Diving into the data, the CryptoQuant chart presents a visual story of these intertwined fates. The spikes in USDT supply, marked by arrows, align with upticks in Bitcoin’s price line, painting a clear picture of the correlation in question. The chart further annotates significant volume peaks, potentially linking increased trading activity with these periods of heightened supply.


