SingularityNET’s AGIX token has drawn considerable attention from investors and traders as it edges closer to a critical resistance point. Setting an alert at the $0.59006 mark, traders should look for a confirmation candle above this price to confirm the breakout. This strategy aims to mitigate risk while capitalizing on the potential upward momentum.
CryptoBusy, a renowned crypto analyst, shared an insightful post regarding the potential significant move for SingularityNet, highlighting how the AI coin is on the brink of surpassing its all-time high.
Moreover, the situation remains fluid, as the token could still form a handle, indicating a potential rejection at the resistance level. Investors are therefore encouraged to either wait for a retest of the level for confirmation or to initiate purchases once AGIX convincingly clears the resistance.
Additionally, the market dynamics on the 4-hour timeframe suggest the formation of a potential double top. This pattern typically indicates a reversal, prompting those with a bearish outlook to consider short positions. However, the advice is to wait for a clear breakdown below trendline support before acting to avoid premature entries based on speculative reversals.
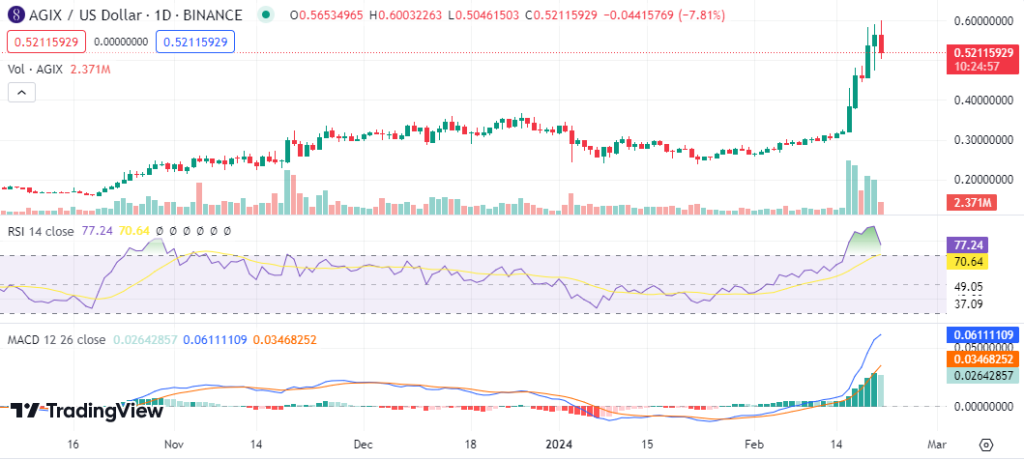
Looking at SingularityNET’s current performance, AGIX is today trading on a bullish note. AGIX is forming higher highs and lows highs on the daily chart as bulls overwhelm the bears on the market. As of this writing, AGIX is exchanging hands at $0.5270, up by over 1% in the past 24 hours.
AGIX has broken out of the consolidation range holding around the $0.2640 range, forming an uptrend pattern on the weekly and monthly charts. The weekly and monthly impressive gains stand at 65% and 86%, respectively.

On the technical front, AGIX displays a strong bullish trend. Most of the indicators hover in the overbought region as the price continues to rally high. The Relative Strength Index (RSI) is heading downwards in the overbought region, suggesting a price correction is imminent in the AGIX’s market. The MACD indicator remains positive as the green bars continue to rule the histogram indicating a strong bullish momentum.


