Ethereum’s Layer 2 ecosystem is witnessing a remarkable upswing, with transaction volumes soaring by an impressive 91% since the beginning of the year, according to insights shared by blockchain analytics firm IntoTheBlock.
This surge in L2 transaction activity underscores the growing significance of scalability solutions on the Ethereum network. Besides, it signals a tangible shift towards more efficient and cost-effective transactions, meeting the increasing demand for improved performance within the blockchain space.
Moreover, the surge in transaction volumes on Layer 2 solutions significantly impacts Ethereum’s overall transaction throughput. This surge comes when scalability concerns have been a focal point of discussion within the blockchain community, emphasizing the potential efficacy of Layer 2 solutions in alleviating congestion on the Ethereum mainnet.
Consequently, the increased adoption of Layer 2 solutions on Ethereum highlights the resilience of the blockchain community in addressing scalability challenges. This development enhances user experience and positions Ethereum as a dynamic and adaptive blockchain platform.
Ethereum’s upward momentum remains robust, prompting valid inquiries about the sustainability of the current rally. The cryptocurrency has effortlessly breached resistance levels, creating an optimistic atmosphere.
Ethereum’s recent price surge reflects robust bullish momentum, with a decisive breach of the $3,000 psychological barrier. The momentum shows no immediate signs of waning, emphasizing the strength of the current uptrend. As of this writing, ETH is trading on a bearish note as the price drops to $3,444, down by 0.33% in the past 24 hours.
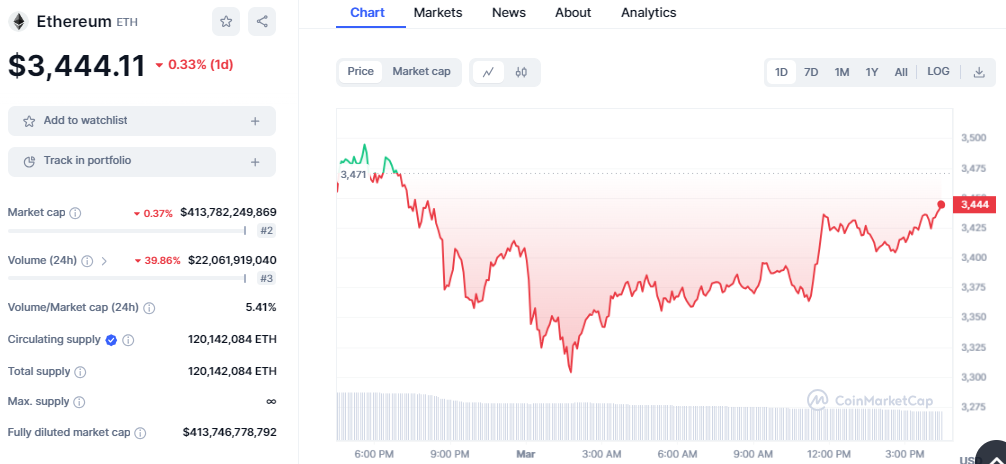
ETH currently finds support at $3,300, aligning with the 50-day moving average, serving as a dynamic support level. The subsequent critical support rests at $3,000, previously a resistance level, now poised to cushion any potential retracement.
Technical indicators on the daily chart display a strong bullish bias. The alignment of moving averages below the current price signifies a formidable uptrend. The Moving Average Convergence Divergence (MACD) indicator showcases ETH’s uptrend as it continues to climb further above the signal line. The rise of green bars on the histogram suggests increased buying pressure.
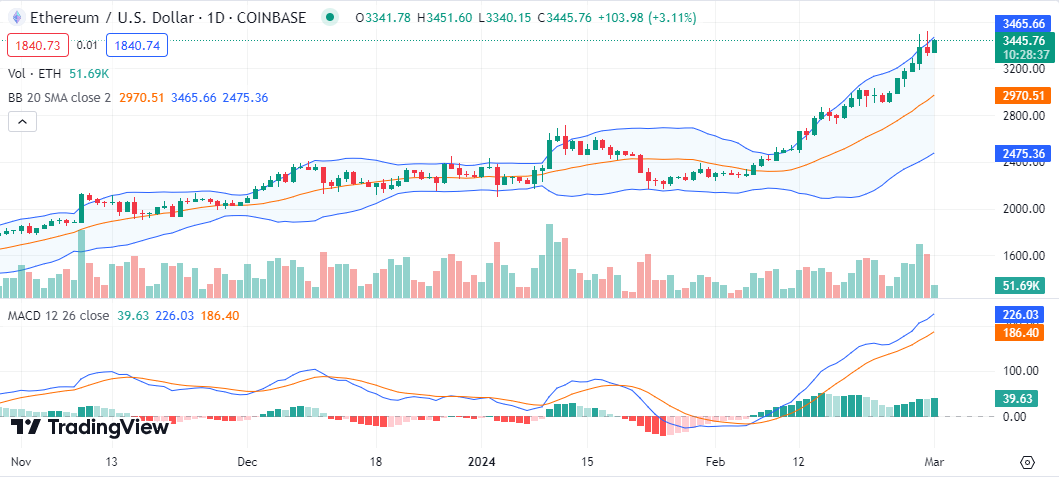
The Bollinger band indicator has widened, indicating a rise in volatility in ETH’s market. Currently, ETH is trading alongside the upper band at 3,465, with the lower band located at 2,475.