
Bitcoin continues its journey through the volatile landscape of the market, with traders closely eyeing various indicators and patterns for clues on its next move. In the midst of this, analysts observe a mix of consolidation and potential continuation patterns, hinting at possible outcomes for investors.
In recent market analyses, Altcoin Sherpa, an analyst, noted the occurrence of continuation patterns, which manifest in diverse ways during bullish phases. These patterns may entail swift dips or periods of consolidation, represented by green candles on price charts. Notably, healthier pausing patterns, akin to those witnessed in January 2021, where prices ranged for several weeks, have been scarce since late January 2024.
Despite the uncertainty surrounding whether the current dip is the extent of the correction or if further price declines are imminent, traders maintain adherence to their established plans. Some opt to take profits over the coming days on select positions while holding additional cash reserves, underscoring a cautious yet proactive approach to market movements.
Examining technical indicators, the daily Relative Strength Index (RSI) and Stochastic indicators have reset, indicating a potential shift in momentum. As per Skew, a crypto analyst, the RSI remains below 50, signaling subdued upside strength, while reclaiming key levels such as the 4-hour 21 and 55 exponential moving averages (EMAs) and the weekly open could instigate a more bullish sentiment.
Market dynamics on platforms like Binance reveal a wide order book, a common precursor to heightened volatility. The significance of reclaiming the $70,000 level is emphasized, suggesting a potential turning point in market sentiment.
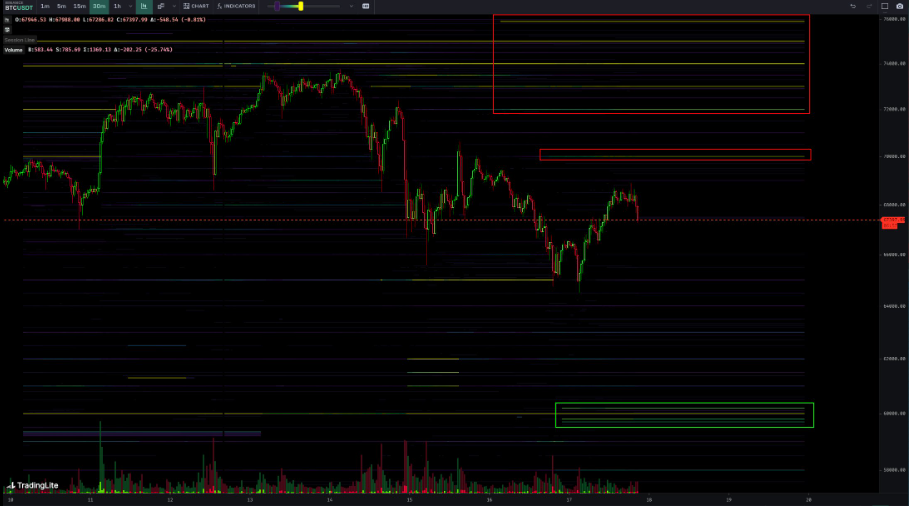
Analysis of cumulative volume deltas and trading flows further illuminates market dynamics. Takers, predominantly driving flow, particularly during price momentum, demonstrate continued dominance. Noteworthy is the observation of sellers’ absorption during weekend lows and buyers’ absorption at recent price highs, indicating ongoing market sentiment shifts.
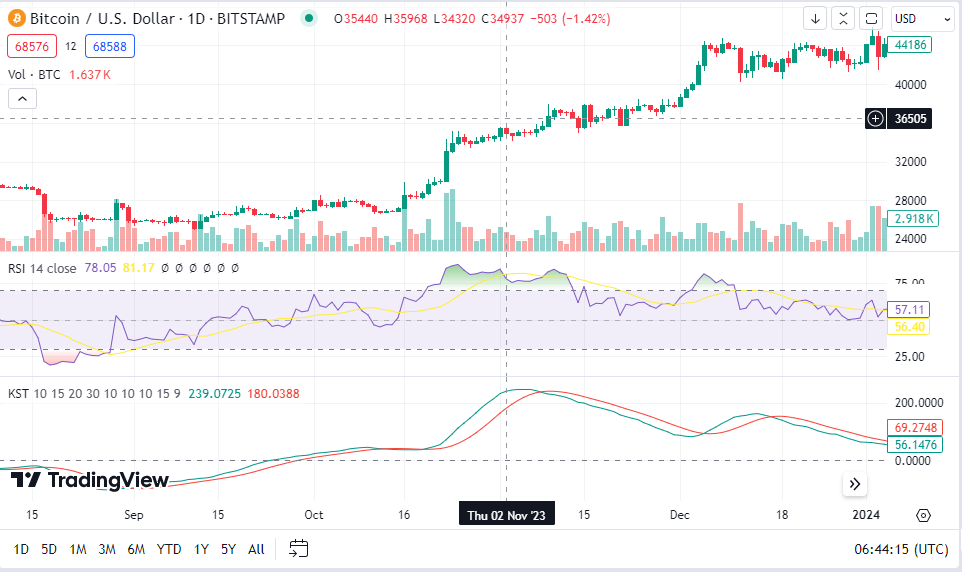
Bitcoin’s current price sits at $68,553.92, with a notable 24-hour trading volume of $44 billion, reflecting a 4.04% increase. However, technical indicators such as the 1-day RSI, MACD, and KST suggest a nuanced picture, with Bitcoin hovering in neutral to bearish territory, potentially signaling caution for investors.