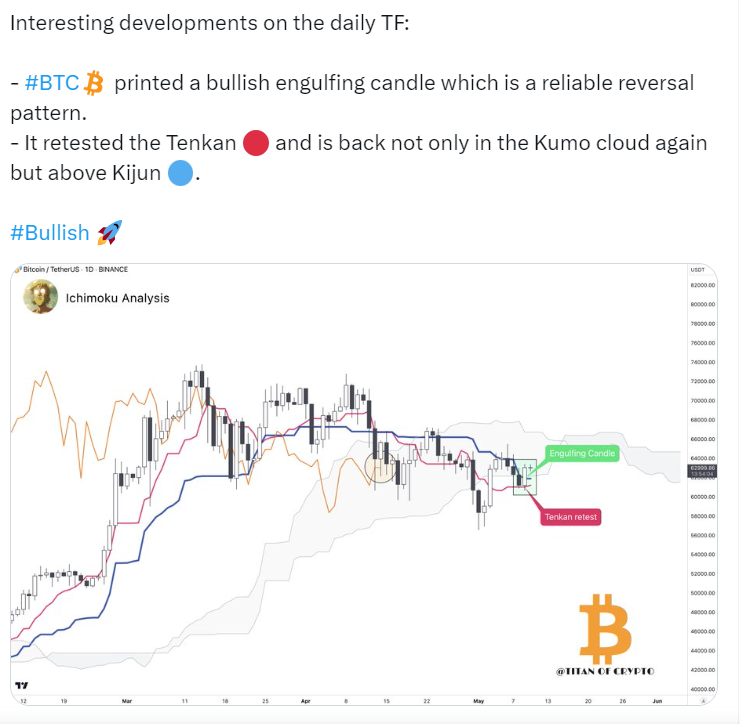
Bitcoin (BTC), showcases promising signs of a bullish reversal. As per analyst Titan of Crypto, a pattern emerged on the BTC daily timeframe with the formation of a bullish engulfing candle, a reliable indicator of potential trend reversal in market sentiment.
The recent price action of Bitcoin witnessed a notable resurgence, marked by a successful retest of the Tenkan line and a decisive move back into the Kumo cloud, now positioned above the Kijun line. This resurgence signals a renewed bullish momentum in the market, prompting analysts to speculate on the next potential targets for Bitcoin’s price.

As further highlighted by Crypto Patel, a top analyst, having broken out above the crucial resistance level at $63,000, Bitcoin managed to sustain its upward momentum, consolidating around this level before embarking on its next leg up. The subsequent retest of support at $60,700 further validated the strength of the bullish trend, paving the way for further upward movement.
Considering these recent developments, analysts have established bold objectives for the price of Bitcoin, foreseeing a possible rally towards the $100K milestone in the foreseeable future. This positive outlook is backed by a sequence of interim targets, spanning $64,500, $66,700, $71,300, along with the anticipation of reaching a new all-time high.

Trading at $63,025.27, Bitcoin’s technical indicators offer additional insights into the current state of the market. The 1-day Relative Strength Index (RSI) hovers around 48.13, indicating a neutral stance, suggesting the potential for either a bullish continuation or a temporary pullback.
The daily Moving Average Convergence Divergence shows a bullish inclination, trading above the signal line at -811.39. This suggests a potential bullish crossover in the short term. Moreover, the daily Average Directional Index records a moderate trend strength of 23.10, indicating market momentum without a distinct directional bias.


