Ali Charts, a technical and on-chain crypto analyst, has identified a notable opportunity in the weekly chart of MATIC, the native token of Polygon, indicating a potential upswing in the coming weeks. The analysis provided by Ali Charts sheds light on various technical indicators and patterns observed in MATIC’s recent price action.
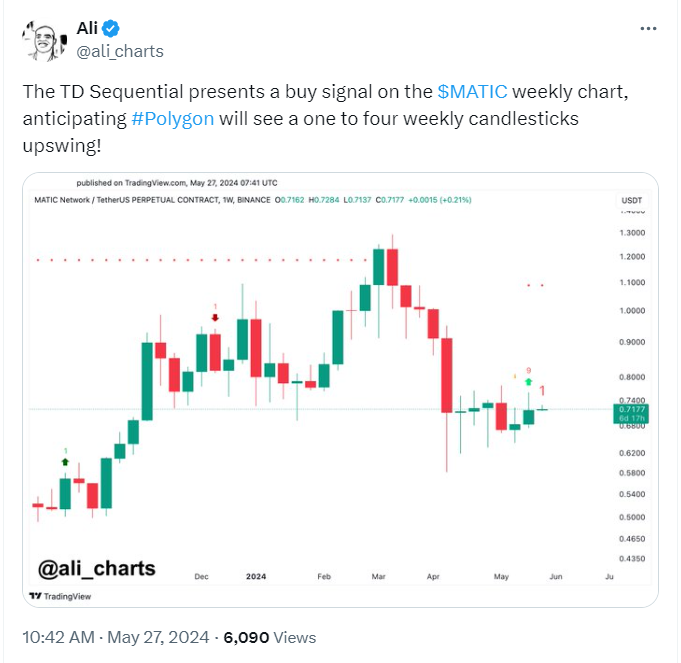
The TD Sequential, a popular technical analysis tool, has recently generated a buy signal on the MATIC weekly chart, suggesting a favorable outlook for Polygon. This signal anticipates a one to four weekly candlesticks upswing, indicating a potential bullish momentum in the near term.
The analysis begins by identifying an initial uptrend in the chart, characterized by a steady increase in price. However, this uptrend is followed by a correction phase marked by increased volatility, as evidenced by longer wicks and larger candles on the chart.
Following the correction, MATIC enters a consolidation phase, with smaller candles indicating reduced volatility. During this phase, key support and resistance levels are identified. The $1.20 mark emerges as a significant resistance level, with multiple candles showing long upper wicks, suggesting a strong barrier to further price appreciation. Conversely, the $0.60 – $0.70 range acts as a notable support level during the consolidation phase.
MATIC Consolidation Hints at Potential 17% Surge Towards $0.88 TargetAnalyzing further, the Relative Strength Index (RSI) for MATIC reads at 51.28, indicating a neutral position for the asset. This suggests that MATIC is neither overbought or oversold at the moment, providing traders with valuable insights for their trading strategies.
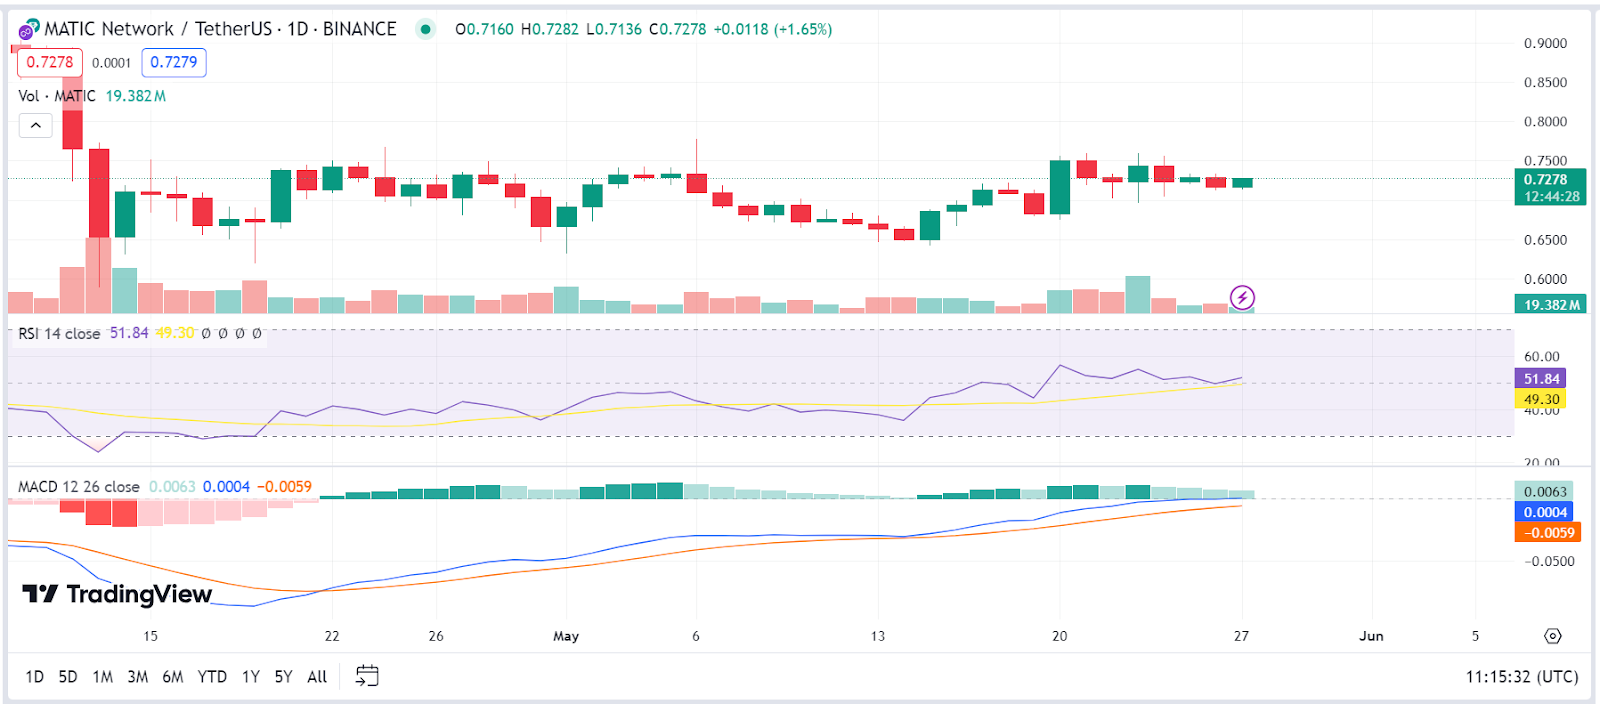
Moreover, the Moving Average Convergence Divergence (MACD) on the daily price chart registers at 0.0004, signaling that there might be a potential bullish trend reversal. The crossing of the MACD line above the signal line suggests a strengthening bullish momentum, although traders are advised to seek confirmation from other technical indicators before making trading decisions.