
According to the coin market cap, Today’s Cardano price analysis shows a downward trend as the selling pressure is still there from the bearish side. Earlier, the market followed the bullish trend yesterday as the coin started to recover, but after recovering up to $0.3678, the selling pressure returned, and the coin seems to be correcting again.
As the trend is bearish for today, the crypto pair continues to cover the range downwards, and the price has very slightly decreased to $0.3494. However, support is present at $0.3407, and the price may bounce back if bulls gain some strength; if not, then the next support is present at the $0.3230 level.

On the other hand, if the bulls gain some strength and push the price above $0.3578, then we can expect a retest of the previous high at $0.3678, followed by a possible break-out for ADA to go higher in the market.
Looking at the 1-day price chart for Cardano price, ADA/USD pair shows bears are defining the price action for today. The ADA/USD has been corrected since late at night after the bullish recovery observed in the previous trading session. ADA/USD pair is trading hands at $0.3494 declining by 2.04% at the time of reporting. The 24 trading volume for Cardano is registered at $343 million, and the market capitalization is found to be $12 billion. The moving average (MA) is present at $0.338 below the current price level.

The volatility for the given price chart of ADA/USD is comparatively high, but the Bollinger bands are continuing to converge, the Upper band has traveled down to $0.378, and the lower band is traveling up to $0.215. The relative strength index (RSI) is also confirming the downtrend for today as it is trading at index 68.6, indicating the bearish pressure in the market as the curve is very slightly downwards.
The 4-hour price chart for Cardano price analysis shows that bearish momentum started at the start of the trading session, and the price breakout was also in the downward direction today. The loss is small, but the coin is unable to recover, and the price has been decreasing slowly for the past 4 hours.
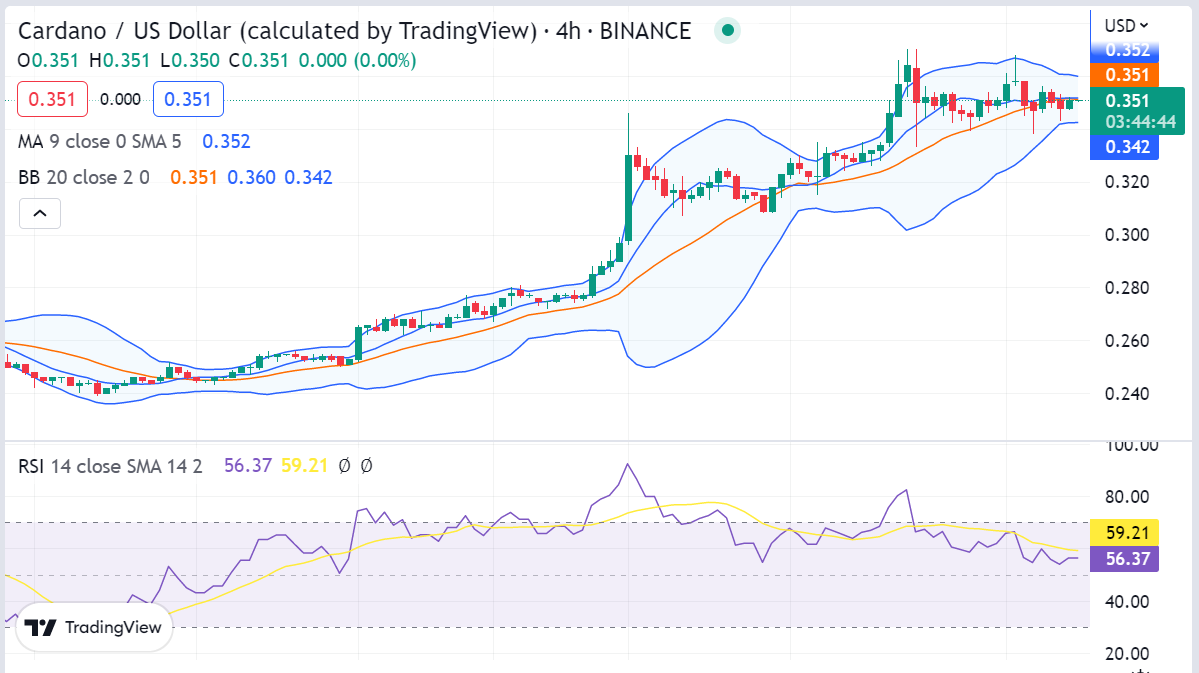
The Bollinger Bands on the 4-hour chart show low volatility for the crypto pair, with the upper band at the $0.360 mark and the lower band at the $0.342 mark. The RSI has been the following movement downwards but is still present in the upper half of the neutral range at an index of 59.21; however, the indicator is hinting at the selling activity in the market.
To sum up, The Cardano price analysis shows that the coin is correcting today and may continue to follow a downtrend for the rest of the day as bears rule the market. The nearest support is present at $0.340, which might help in preventing the downfall. Overall the cryptocurrency is expected to trade near the current price level as the consolidation continues.