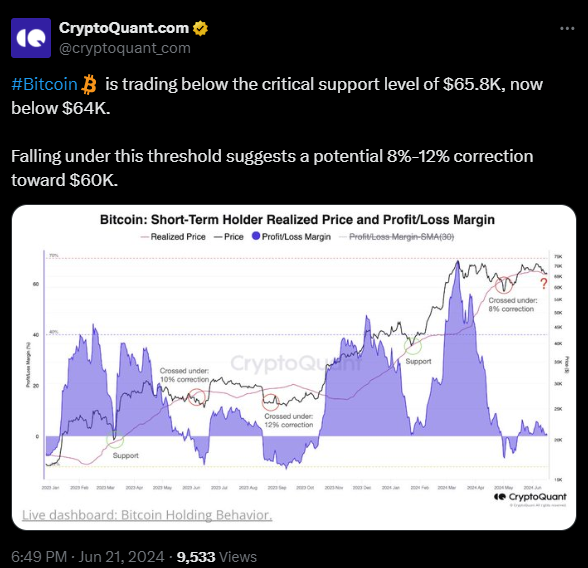
Bitcoin has recently dipped below the critical support level of $65,800, now trading at $64,377.82. As highlighted by CryptoQuant, an On-chain analytic firm, this decline has sparked concerns among investors, as falling below this threshold often signals a potential correction of 8% to 12%, bringing Bitcoin closer to the $60,000 mark.
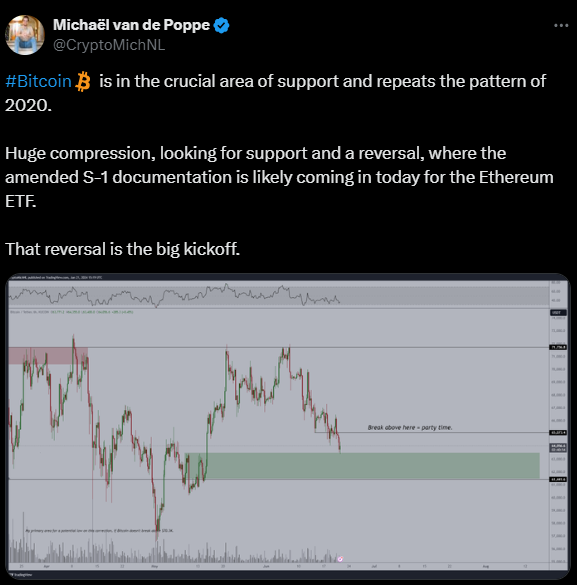
This movement is reminiscent of patterns observed in 2020, where significant price compressions were followed by searches for support and subsequent reversals.
According to Michaël van de Poppe, an analyst, this period of compression coincides with the anticipated release of the amended S-1 documentation for the Ethereum ETF. Such a development could potentially catalyze the much-anticipated reversal, marking a significant event for the cryptocurrency market.
In the last 24 hours, Bitcoin’s price has decreased by 0.29%, accompanied by a trading volume of $24,179,184,106. These statistics reflect a slight downturn, suggesting cautious sentiment among traders. However, a closer examination of the derivatives market reveals a mixed bag of trends.
Global Bank Standard Chartered Ventures into Bitcoin and Ether TradingAs per Coinglass data, there has been a significant decrease in trading volume by 11.78%, and options volume has plummeted by 39.73%, indicating reduced trading activity overall. Despite this, the open interest in options has increased by 2.18%, pointing to a growing interest in holding options contracts.
The 24-hour long/short ratio stands at 0.9425, indicating a marginally higher number of short positions. This ratio implies a slightly bearish sentiment, with more traders betting on a price decline in the short term.
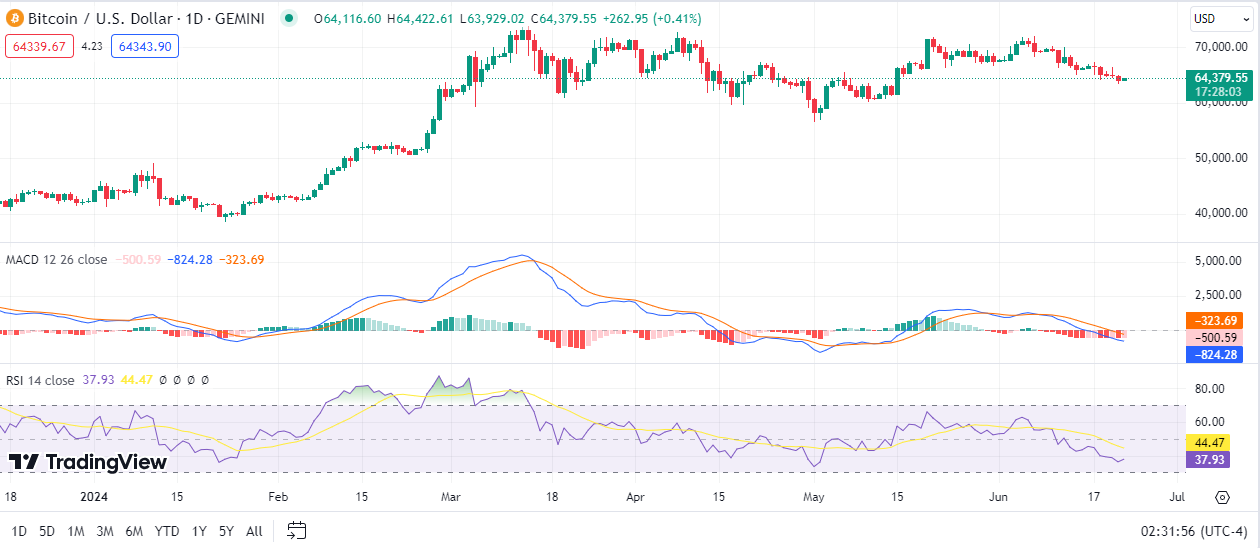
Furthermore, the 1-day RSI (Relative Strength Index) of 37.93 positions Bitcoin is approaching an oversold condition. Traders may look for potential buying opportunities if the RSI drops further towards 30. Additionally, the 1-day MACD (Moving Average Convergence Divergence) trading below the signal line reinforces the short-term bearish trend.