
The price action of FLOKI is currently displaying an ascending triangle pattern on the daily timeframe, signaling potential bullish momentum. An ascending triangle is characterized by an upward sloping support line and a horizontal resistance line.
In this case, the support line has shown consistent higher lows, indicating strong buying interest at increasing price levels. As highlighted by Jonathan Carter, an analyst, the critical support zone around $0.00016500 has been tested multiple times, reinforcing its significance.
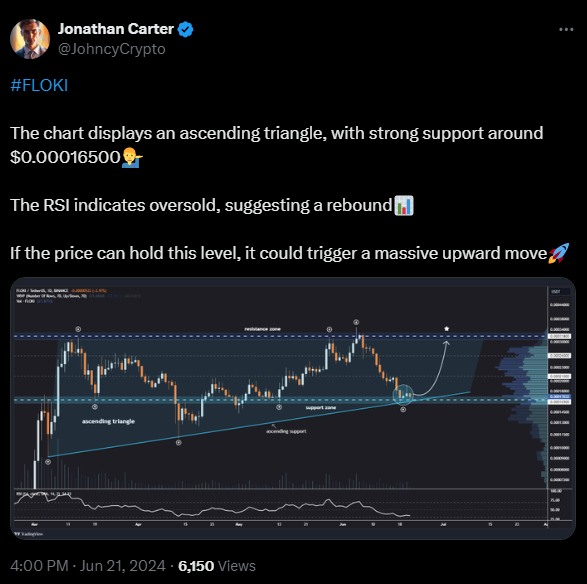
The resistance zone near $0.00034000 has repeatedly halted upward movements, creating a potential breakout point. The volume profile on the chart reveals significant trading activity around the support level of $0.00016500. This volume concentration underscores the importance of this price level, as it suggests strong investor interest and trading activity in this range.
Is PEPE Poised For A Distribution Phase Like FLOKI? Analyst’s InsightsThe Relative Strength Index (RSI) is currently at 34.23, indicating the price is in the lower range but not yet oversold. This suggests that there is room for a rebound if buying pressure increases. The current price is positioned near the ascending support line, making this a critical juncture for the next move.
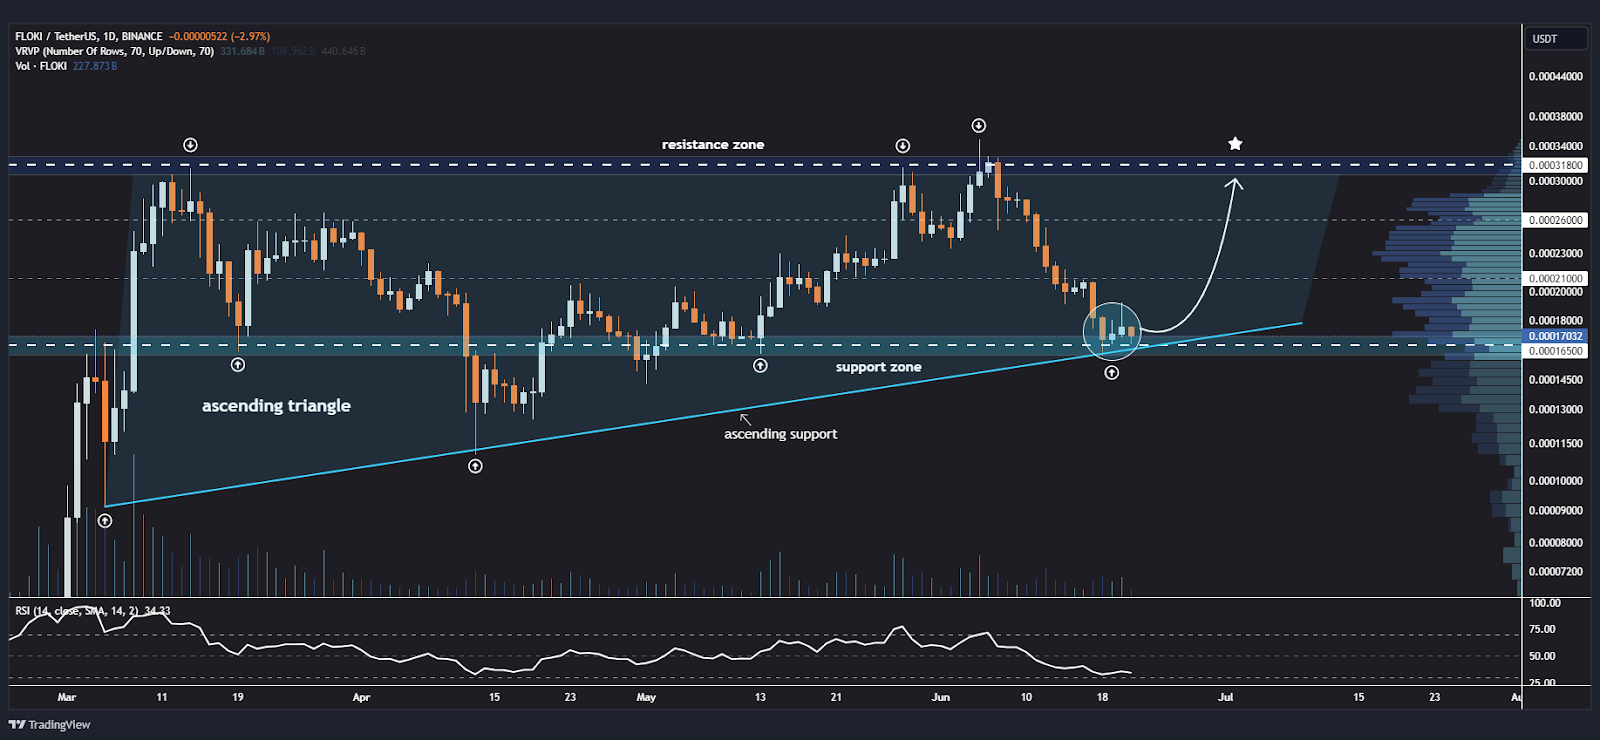
If the price respects the ascending support line and bounces off the $0.00016500 support zone, it could head toward the resistance zone at $0.00034000. A breakout above this resistance zone could signal a strong bullish trend, potentially leading to higher price targets.
Conversely, if the price breaks below the ascending support line and the support zone, it could indicate a bearish trend. Identifying the next support levels below the current zone would be essential to anticipate further price declines.
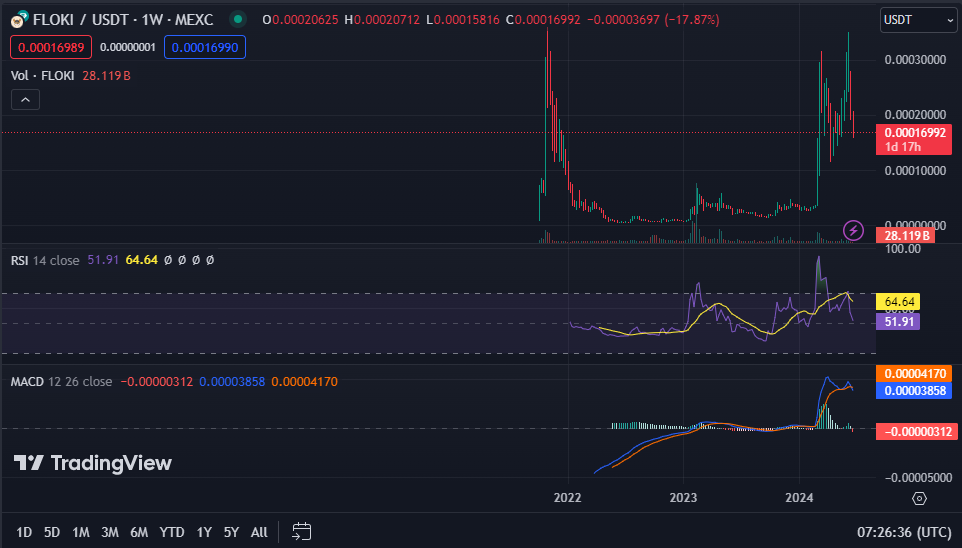
Additionally, the live FLOKI price at press time is $0.000170, with a 24-hour trading volume of $203,941,747, down 0.66% in the last 24 hours. The 1-week RSI currently reads 51.92, indicating that the stock is neither overbought nor oversold. This suggests a potential continuation of the current trend in the short term. However, the 1-week MACD trading below the signal line indicates a possible upcoming bearish trend.