
Ethereum (ETH), a leading cryptocurrency, exhibits a bullish pattern, according to the latest technical analysis by crypto analyst Charting Guy. His insights reveal a rising channel that captures Ethereum’s price dynamics effectively over the years.
The chart, featuring line graphs and candlestick patterns, identifies critical highs and lows marked by ‘X’ and triangles, providing a comprehensive view of the market’s movements.

A prominently displayed moving average, cast in red, smooths out Ethereum’s price variations, illustrating a steady bullish trend. This trend suggests Ethereum might consistently approach the upper limits of this rising channel.
Such movements hint at possible new peaks as head towards 2025, making now a potential strategic time for investors to consider their positions.
The analysis points to specific support and resistance levels, offering valuable information for traders to optimize their market entries and exits. Despite market fluctuations and occasional dips, Ethereum’s trajectory remains promising within this upward channel.
Including these technical insights offers a clear guide for understanding Ethereum’s future price movements. Monitoring these trends will be crucial for those investing in cryptocurrency as the market evolves.
Ethereum has seen a market recovery after a significant drop earlier this month, rallying to reach the $3,000 mark as of today. The price of Ethereum increased by 5.27% over the last 24 hours, reflecting a robust recovery trend in the cryptocurrency market.
Ethereum’s Strategic Shift: Separating Execution from Consensus in BlocksEthereum’s market capitalization currently stands at $360.6 billion, positioning it as the second-largest cryptocurrency by market cap.
Trading volumes decreased 39.07% within the same period, totaling $17.83 billion. Despite the decline in trading volume, the market cap increased by 5.28%, signaling strong investor confidence.
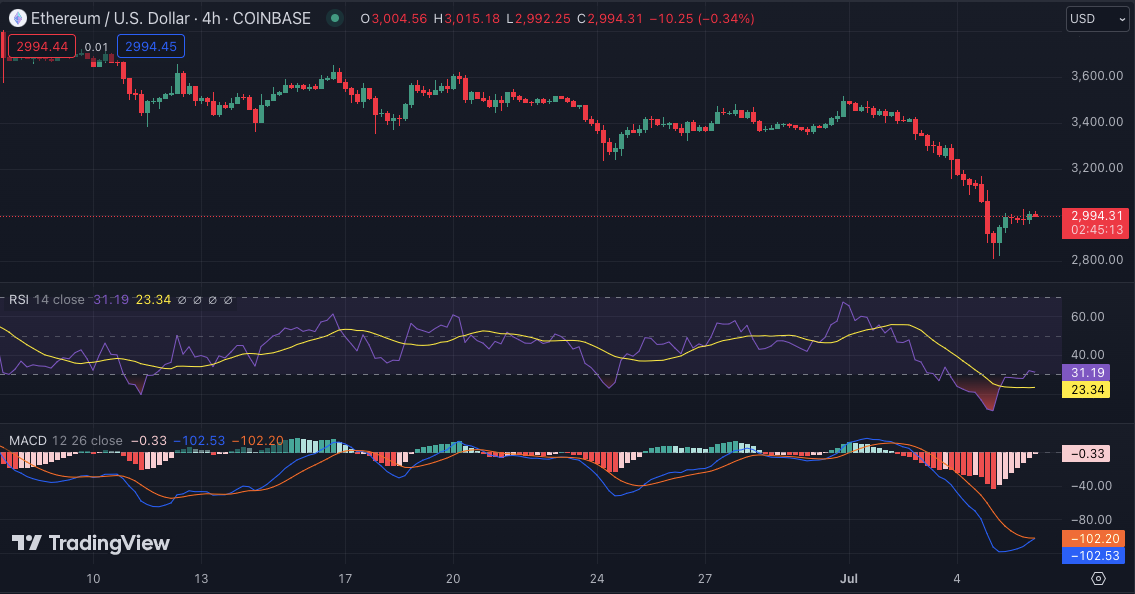
The 4-hour technical indicators for the ETH price show a price recovery after a significant downtrend. The Relative Strength Index (RSI), currently at 31.19, suggests that Ethereum is significantly oversold, potentially indicating an impending rally if buyers step back in.
Meanwhile, the Moving Average Convergence Divergence (MACD) exhibits a momentum loss in the bearish trend, as the MACD line (blue) is converging towards the signal line (orange), hinting at a possible bullish crossover.