
VeChain (VET) has been navigating a downward trajectory since early April, as outlined in a recent analysis by a prominent crypto analyst on X. This trend continued through May, with the price consistently forming lower highs and lower lows, signaling a robust bearish momentum within a descending channel. The analysis was shared on a well-known trading platform, highlighting critical technical patterns and projections for VET.
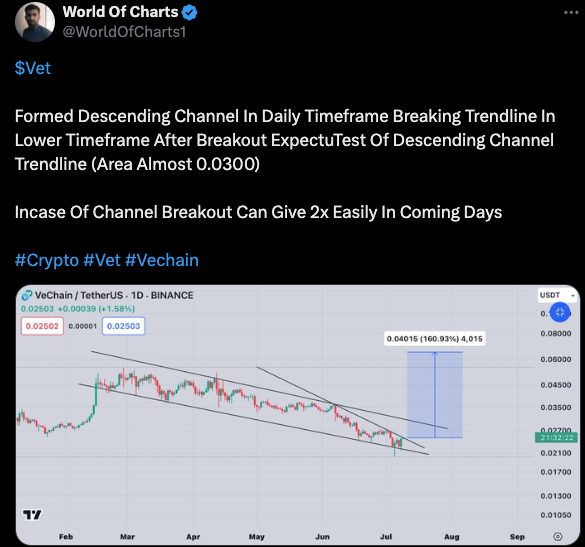
According to the analyst, VeChain is currently trading within a descending channel. However, a recent breakout in a shorter timeframe indicates a possible shift in momentum.
The downtrend could be significantly reversed if the price exceeds the crucial support level of around $0.021. The projection box in the chart suggests a potential rally, targeting a price of $0.04015, a substantial 160.93% increase from the current levels.
The chart and analysis by the crypto analyst point toward an intriguing phase for VeChain, where holding above $0.021 could pave the way for a notable price recovery. This scenario offers an optimistic outlook for traders and investors eyeing potential gains in the coming days.
Will Elliott Wave Theory Push VeChain (VET) Price to $235? An AnalysisVeChain’s price has rebounded strongly in the last 24 hours, marking a significant increase of 6.68%. The cryptocurrency is currently trading at $0.02512. The surge comes after a notable dip, where the price dropped to as low as $0.02353. However, following the dip, VeChain’s value gradually climbed, reaching a high of $0.0251.
The total market capitalization of VeChain now stands at approximately $2.03 billion, securing it the 41st position in market rankings. Trading volume for VeChain has also seen a substantial uptick, with a 29.88% increase in the last day, totaling around $57.65 million. This suggests a heightened interest and activity among traders and investors.
The current circulating supply of VeChain (VET) is around 80.99 billion, constituting 93.39% of its total possible supply of 85.99 billion.

The 4-hour technical indicators for VeChain against the US dollar show a mixture of bearish and bullish signals. The Relative Strength Index (RSI) stands at approximately 59, having climbed from lower levels, indicating a stronger buying momentum. Conversely, the Moving Average Convergence Divergence (MACD) presents a subtle bullish crossover as the MACD line (blue) crosses above the signal line (orange), suggesting potential for an upward price movement.