The prices of popular memecoins Bonk (BONK) and Pepe (PEPE) are experiencing significant increases, reflecting a notable shift in market sentiment. Following a recent weekend pullback, these cryptocurrencies are showing strong upward trends, raising questions about their potential surge by 20% and entering bullish patterns.
At the time of writing, the price of Bonk (BONK) stands at $0.00002646, marking a 15.99% increase in the last 24 hours. Its market capitalization has risen to $1.82 billion, up 16.77%. Additionally, the 24-hour trading volume has surged to $525.61 million, reflecting a 77.61% increase. The market’s renewed interest in BONK has established key support and resistance levels crucial for future price movements.
Key support levels for BONK include $0.00002316, which represents a recent low before the upward trend began, and $0.000022, indicating a prior consolidation period. These levels highlight where buyers have previously stepped in, providing a strong foundation for the price.
Conversely, significant resistance levels are at $0.000027 and $0.000025. The price faced selling pressure and retraced at $0.000027, making it a critical level to watch. If BONK can break above and sustain this level, it may signal further bullish momentum. The $0.000025 level, which previously acted as resistance, may serve as support if the price retraces.
At press time, the price for Pepe (PEPE) is $0.000009307, reflecting a 5.89% increase in the last 24 hours. Its market capitalization has grown to $3.92 billion, up 3.06%, with a 24-hour trading volume of $1.07 billion, up 9.48%. The increased trading activity indicates strong market engagement with PEPE, setting the stage for potential further gains.
Crypto Analyst Predicts Temporary Upside for PEPE Amid 40% DowntrendKey support levels for PEPE include $0.00000886 and $0.00000884. These levels show where the price found support before moving higher, indicating buyer interest. Resistance levels at $0.00000940 and $0.00000931 are significant as the price faced selling pressure and retraced at these points. Breaking above these levels could signal sustained upward movement.
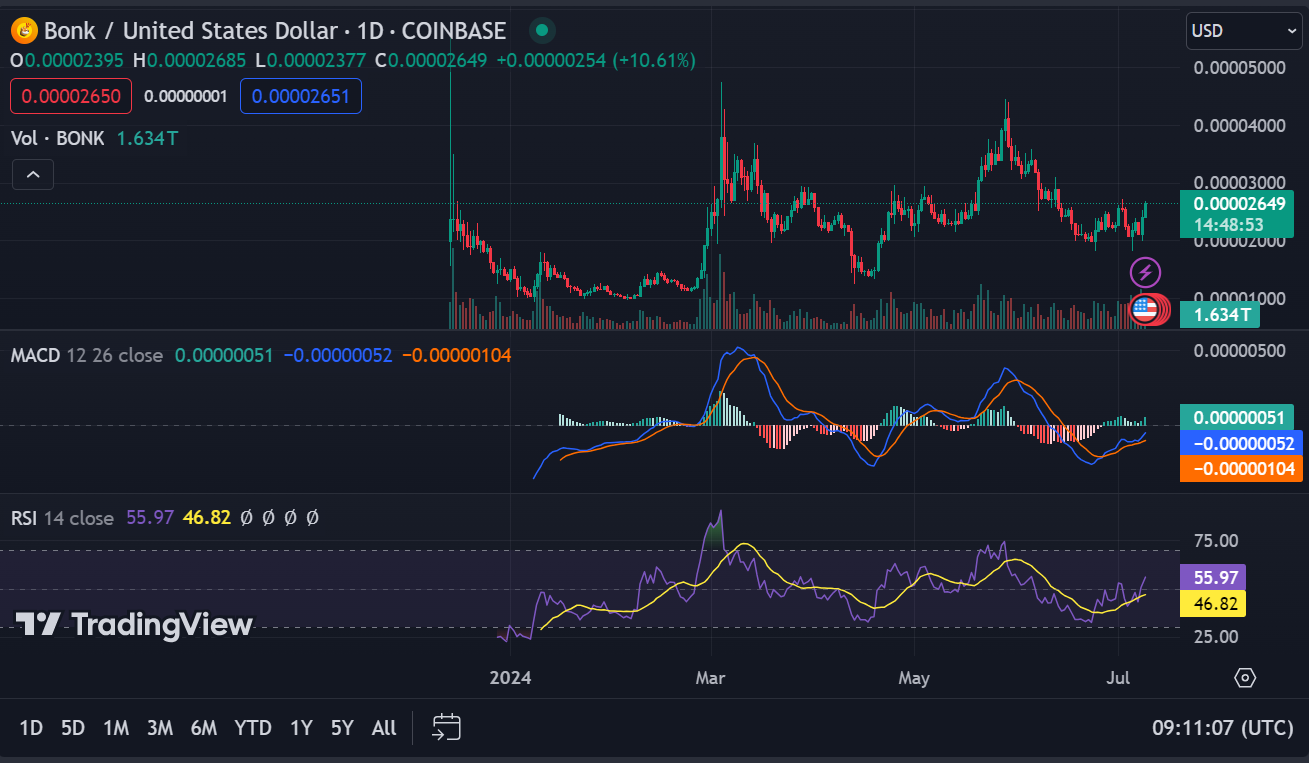
Analyzing technical indicators, BONK’s 1-day Relative Strength Index (RSI) reads 55.88. This suggests the stock is neither overbought nor oversold, indicating a potential for further price movement in either direction. However, the 1-day Moving Average Convergence Divergence (MACD) line is trading above the signal line, indicating a bullish trend in the short term.
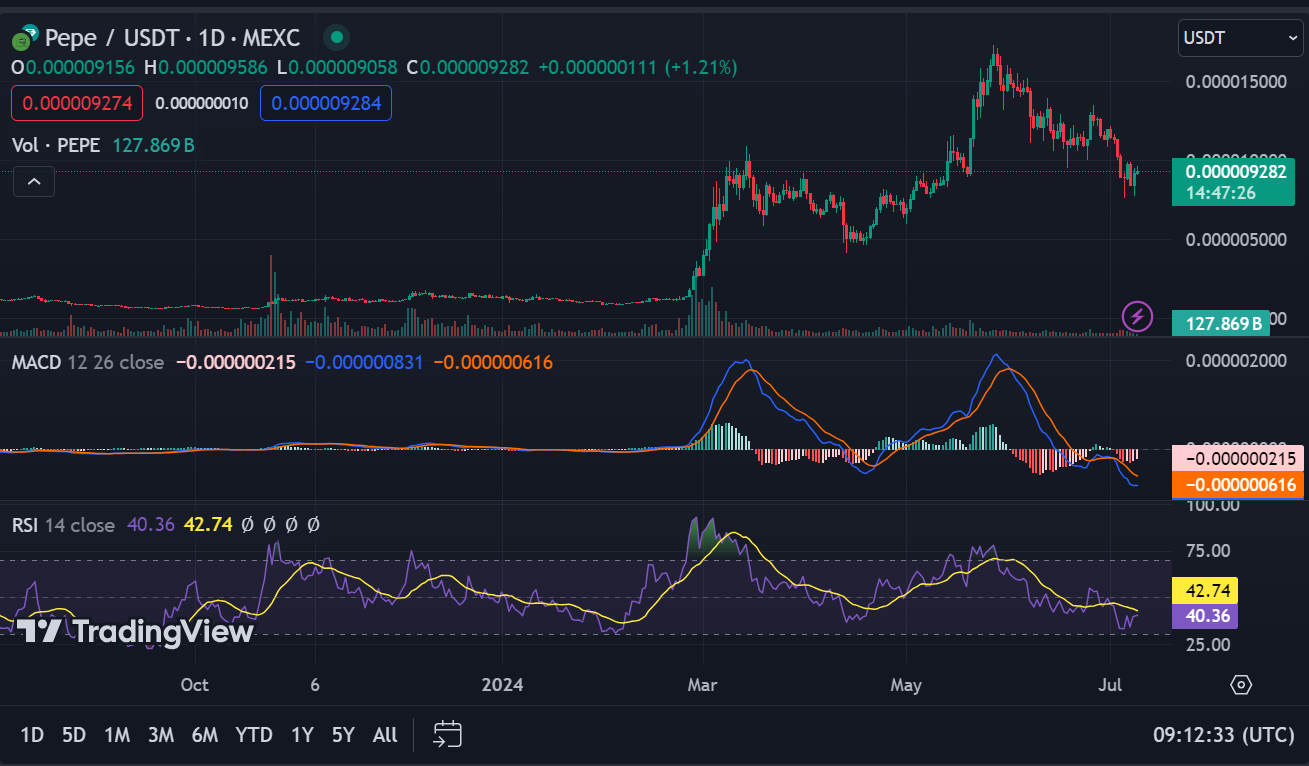
For PEPE, the 1-day RSI reads 40.36, approaching oversold conditions but not yet in a strong buying position. The 1-day MACD trading below the signal line suggests downward momentum in the short term.