
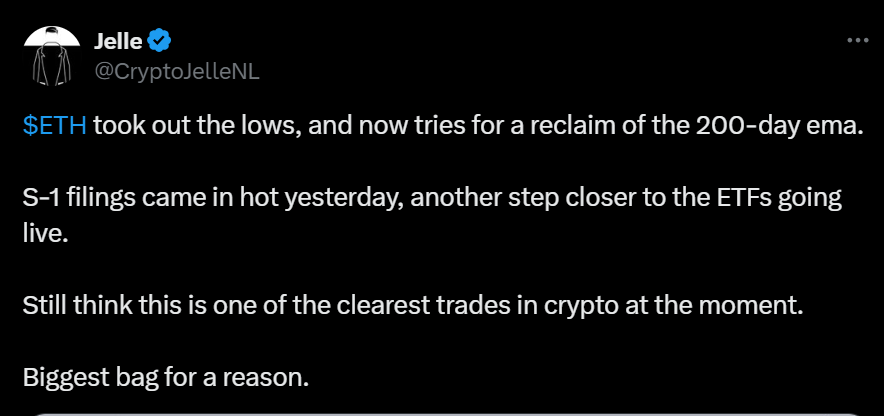
Ethereum (ETH) is currently making headlines as it attempts to reclaim the 200-day exponential moving average (EMA) after recently hitting new lows. As highlighted by CryptoJelle, an analyst, S-1 filings for cryptocurrency ETFs have recently surged, marking another critical step towards these financial products going live. Among the anticipated ETFs, the Ethereum ETF is projected to start trading on July 15th, which could significantly influence Ethereum’s price dynamics.
According to Michaël van de Poppe, CIO & Founder of MN Trading Consultancy, this week market participants are also closely watching Jerome Powell’s testimony on policy and the release of new Consumer Price Index (CPI) and Producer Price Index (PPI) data. These economic indicators will have a substantial impact on Yields and the US Dollar Index (DXY), further influencing the crypto market.

Ethereum’s price trend on a 1-day timeframe, pattern suggests a bearish continuation. The upper boundary slopes downward, while the lower boundary remains relatively horizontal, indicating a series of lower highs and consistent support levels.
Key support levels are identified around $3,000 and $2,900. The $3,000 level has recently acted as critical support, and maintaining this level is crucial to prevent further decline. The $2,900 level represents a previous low and another significant support point.
Resistance levels are around $3,300 and $3,600. The $3,300 level coincides with a previous consolidation zone and may act as resistance if the price attempts to move higher. Similarly, the $3,600 level is another significant resistance point observed in the recent past.
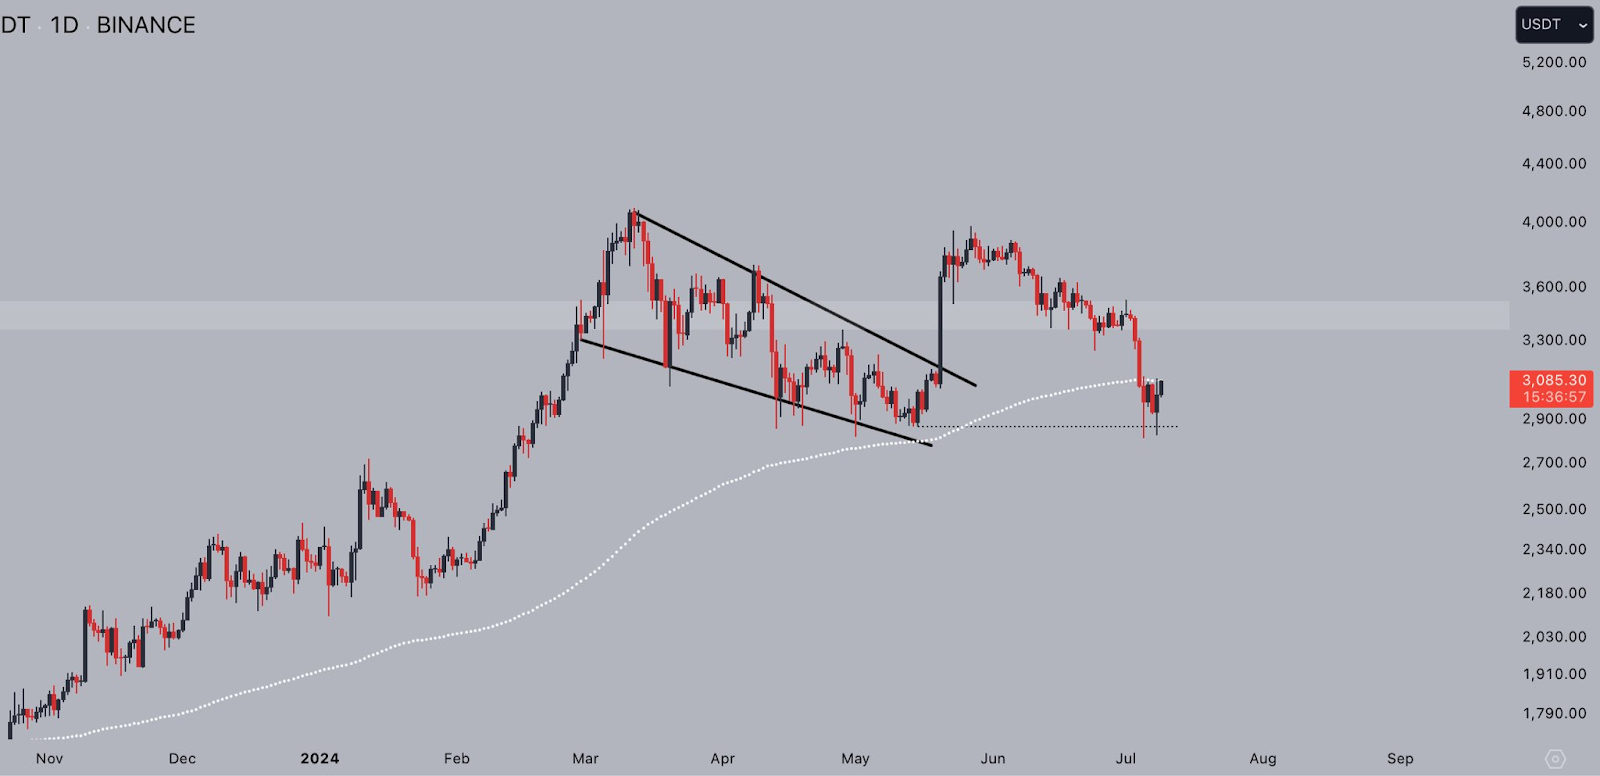
Price action shows that Ethereum broke below the descending triangle pattern, indicating a bearish trend continuation. Although the recent candlestick shows a slight recovery, the price remains below key resistance levels, suggesting ongoing bearish sentiment. The moving average, represented by a dotted line likely indicating the 200-day MA, was recently tested and dropped below, reinforcing the potential bearish outlook.
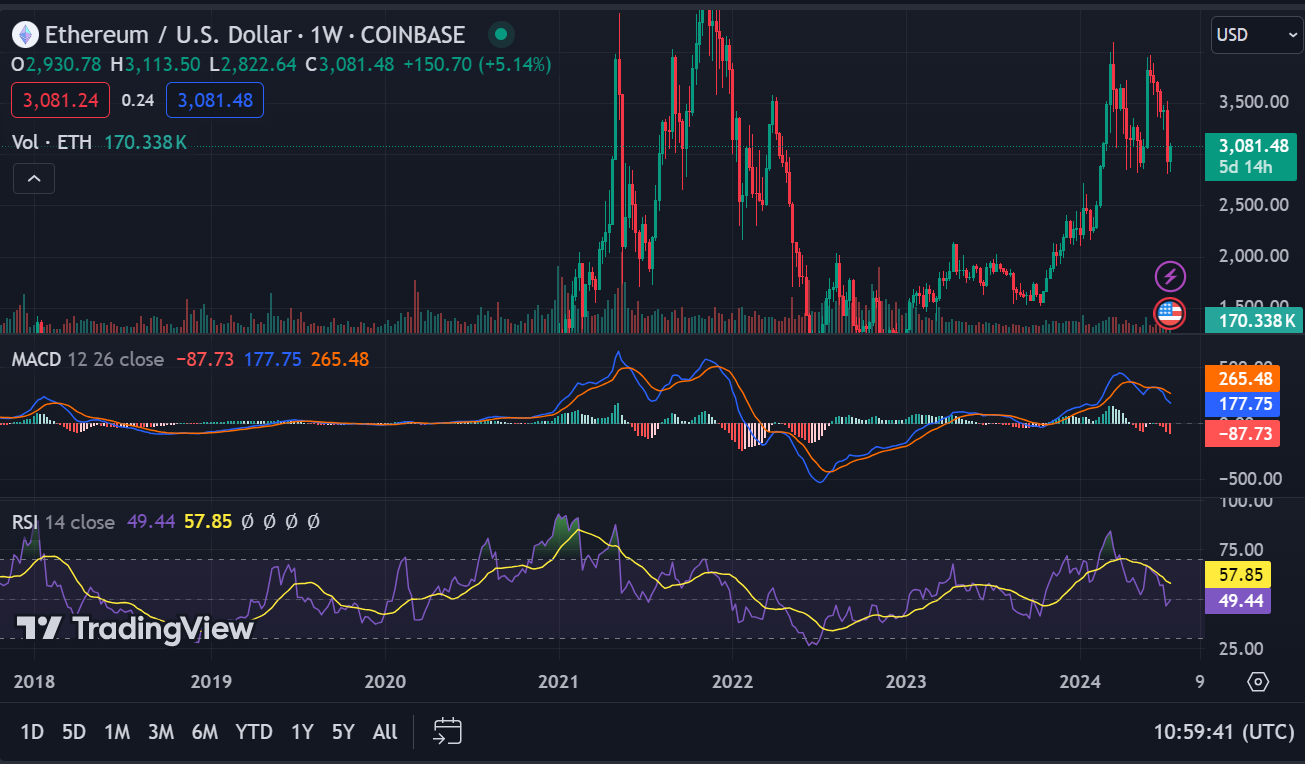
Ethereum’s 1-week RSI reads 49.40, suggesting a neutral position. However, the 1-week MACD trading below the signal line indicates potential downward pressure on Ethereum’s price in the short term.
At press time, Ethereum’s live price is $3,083.69, with a 24-hour trading volume of $19,229,214,577. The price has seen a slight increase of 0.93% in the last 24 hours, reflecting ongoing market volatility.