
Ethereum (ETH) is navigating crucial levels amidst fluctuating market sentiment, as it strives to reclaim the 200-day Exponential Moving Average (EMA) as highlighted by CryptoJelle, an analyst. Priced at $3,070.49 at press time, Ethereum has seen a 2.17% decline over the last 24 hours, reflecting the ongoing volatility in the cryptocurrency market.

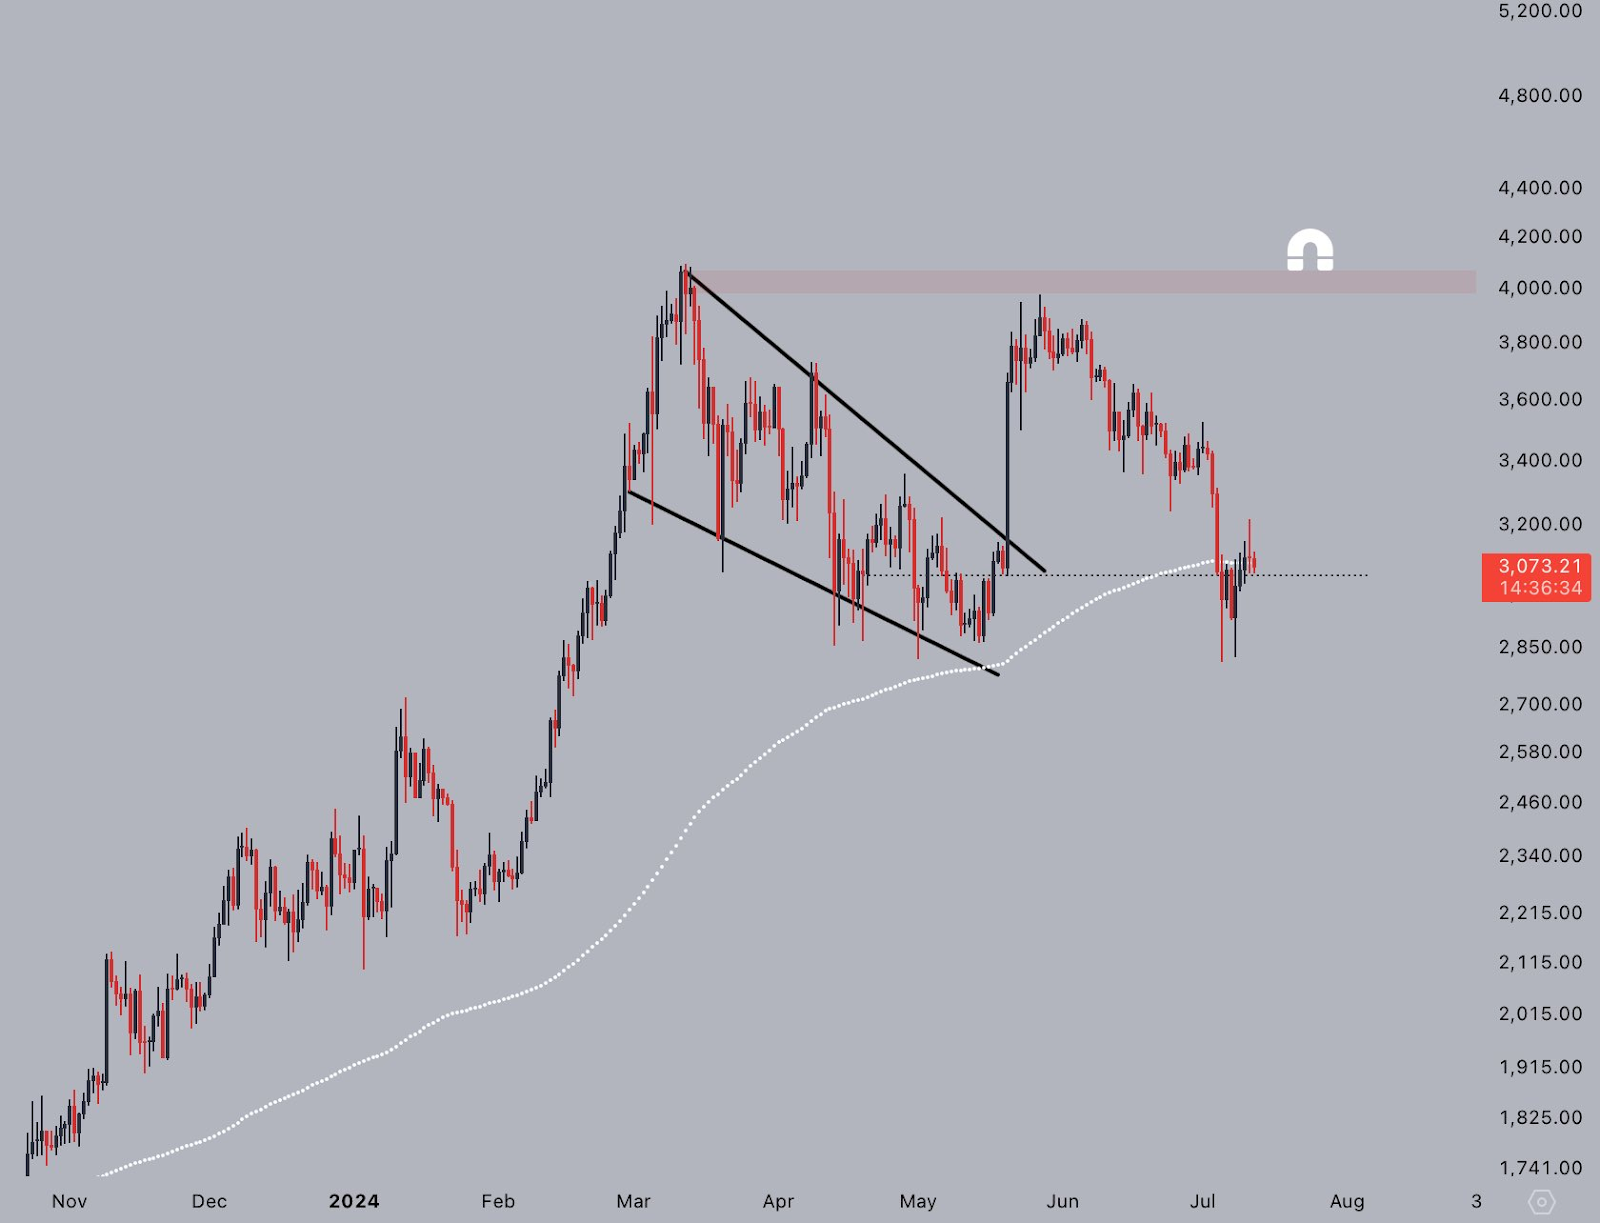
The recent price action of Ethereum reveals a complex technical landscape. From November 2023 to April 2024, Ethereum surged to highs near $4,400, riding an uptrend wave. However, the subsequent formation of a descending wedge pattern signaled a potential reversal. Although Ethereum briefly broke out from this pattern in June 2024, the bullish momentum was short-lived, resulting in a significant pullback.
The $4,400 mark stands as a formidable resistance, having thwarted multiple attempts by Ethereum bulls to surpass it following the wedge breakout. Conversely, the $3,000 support level, coupled with the 200-day moving average (MA), has emerged as a critical zone for potential reversals.
Justin Sun’s Bold Ethereum Moves: A Strategic $1.11 Billion InvestmentPresently, Ethereum hovers just above the $3,000 support and the dynamic 200-day MA. This juncture presents a pivotal moment for the cryptocurrency; a sustained hold above these levels could embolden buyers to target the $3,400-$3,800 range once more. A decisive breach above this range might even set the stage for a renewed assault on the elusive $4,400 resistance.
Conversely, a failure to maintain above $3,000 could expose Ethereum to further downside pressure. Potential support zones lie near $2,700 and $2,400, marking critical levels where increased selling activity could materialize.

Ethereum’s 1-week Relative Strength Index (RSI) of 49.14 suggests a neutral stance, indicating neither oversold nor overbought conditions. Meanwhile, the Moving Average Convergence Divergence (MACD) line below the signal line hints at potential bearish tendencies in the short term.