XRP, the digital asset under scrutiny for its price movements and regulatory clarity, has shown a notable surge in recent trading sessions. Priced at $0.5122 at press time, XRP has experienced a significant increase of 10.17% amidst its daily price action, reaching a recent high of $0.5077 after a low of $0.3823. This upward momentum is supported by key technical indicators and strategic support levels that delineate its current trajectory.
Analyzing the price trend, XRP faces immediate resistance at $0.5077, a critical level coinciding with the MA(99) line as per Egrag Crypto, an analyst. Should the price surpass this barrier, the next resistance zone lies near $0.5605, marking a previous high observed in historical data.
XRP Shows Signs of Bullish Breakout Amidst Forming Falling WedgeConversely, crucial support emerges at $0.3823, a level from which the recent rally initiated, reinforced by the MA(7) at $0.4492, providing initial defense against potential downturns.
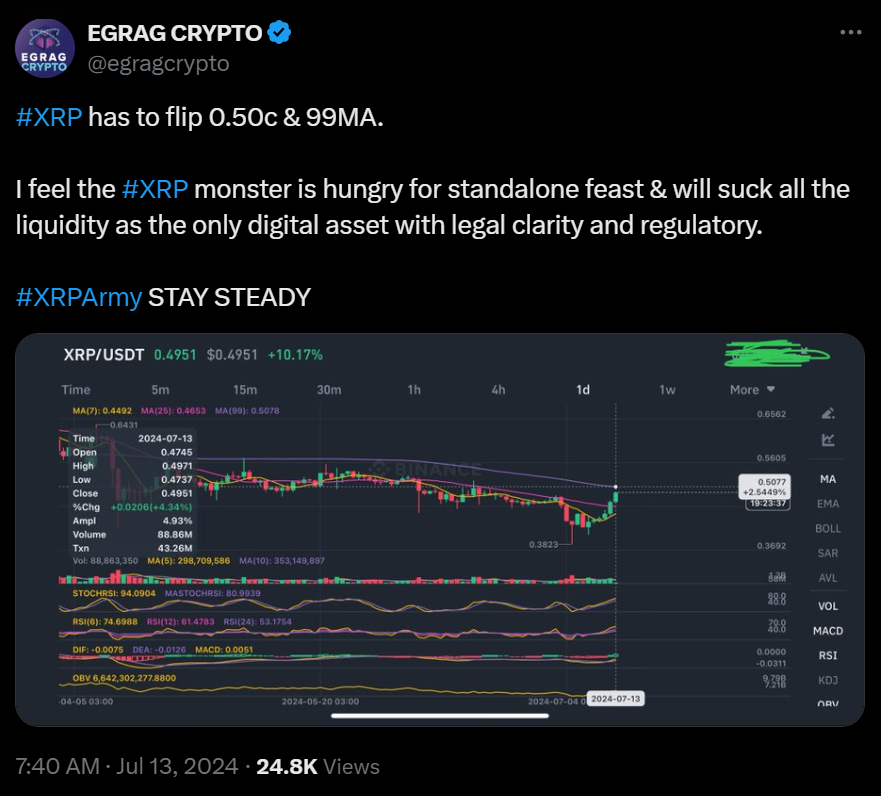
Technical indicators further underscore XRP’s bullish sentiment. The Relative Strength Index (RSI) stands at 74.6988, indicating overbought conditions, potentially prompting a period of consolidation or correction. Similarly, the Stochastic RSI at 94.0904 corroborates this, suggesting caution despite bullish momentum.
Meanwhile, the Moving Average Convergence Divergence (MACD) remains slightly positive at 0.0051, with the MACD line holding above the signal line, albeit with minimal divergence, signaling cautious optimism among traders.

The On-Balance Volume (OBV) registers significant volume at 6,642,302,277.8800, reinforcing the recent upward movement in XRP’s price. This surge in trading volume bolsters the bullish outlook, aligning with the asset’s current market sentiment and investor interest.

XRP’s 1-week RSI reading of 48.45 indicates neutrality, suggesting a potential consolidation phase before any decisive price action. Notably, the 1-week MACD trading below the signal line implies a short-term bearish outlook, warranting careful monitoring of market dynamics.