
Bitcoin, a leading cryptocurrency, has exhibited notable volatility over recent periods, particularly at key Fibonacci retracement levels, as highlighted by analyst CryptoBusy in a recent X post. The analysis meticulously maps Bitcoin’s price from late May into July, depicting a downturn and a bullish rebound indicative of a potential recovery.

Bitcoin struggled, marking a descent that eventually found a bottom before making a sharp upward turn. This movement has been keenly analyzed using Fibonacci levels, where key potential support and resistance areas were anticipated. Bitcoin challenges the 0.618 Fibonacci level, a critical resistance point following its recent rise.
Crypto Rebound Spurs Litecoin and XRP FOMO, Bitcoin, and Popcat SurgeA bullish flag pattern has been identified amid this surge, suggesting the possible continuation of upward momentum if Bitcoin breaks higher from this formation. The resilience at these levels could dictate Bitcoin’s short-term price actions, with traders closely monitoring these markers.

The recent updates on the charts by CryptoBusy reveal an optimistic trend, with Bitcoin aiming for a high resistance near $63,010. The commentary accompanying this analysis underscores the importance of the $62,000 level, which has oscillated between acting as a support and a resistance through the period under review. Maintaining above this level could be instrumental in Bitcoin sustaining its mid-term bullish outlook.
Bitcoin’s journey through these Fibonacci levels and resistance points paints a narrative of resilience and potential bullish reversal, especially evident in the triple bottom pattern around the $56,000 mark. This pattern indicates a strong base forming, potentially catalyzing a push towards higher resistances.
Over the past 24 hours, Bitcoin (BTC) has seen a notable uptick in trading activity and price movement. As of the latest data, Bitcoin’s price is $63,508.12, marking a 0.94% increase over the day.
The cryptocurrency’s market capitalization has also risen by 1.04%, reaching approximately $1.25 trillion, reaffirming its position as the top digital asset by market value. Trading volume surged by 41.95% to $36.06 billion, indicating a heightened level of investor engagement.
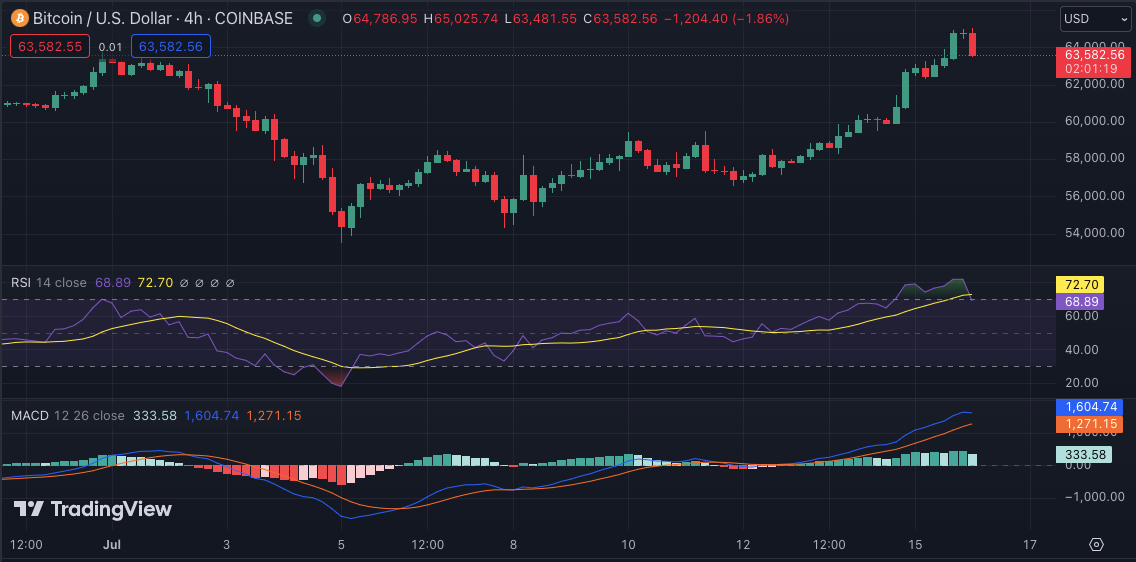
The 4-hour technical indicators for Bitcoin (BTC) reveal notable market movements. The Relative Strength Index (RSI) is currently at 68. This positions the RSI near overbought territory, suggesting that Bitcoin is on the bullish side.
The Moving Average Convergence Divergence (MACD) shows the MACD line (blue) above the signal line (orange). This indicates a bullish momentum in the near term. However, the histogram, which measures the distance between the MACD line and the signal line, is starting to show reduced momentum as the bars decrease in size.