
PEPE has recently made significant waves with a sharp upward surge, catching the attention of traders and analysts alike. After a prolonged period of decline, the digital asset appears to be staging a potential comeback, marked by a notable breakout from its previous downtrend. Trading at $0.000012 at press time, $PEPE has seen a remarkable 23.32% increase in its value over the past 24 hours, reflecting renewed investor interest and trading activity.
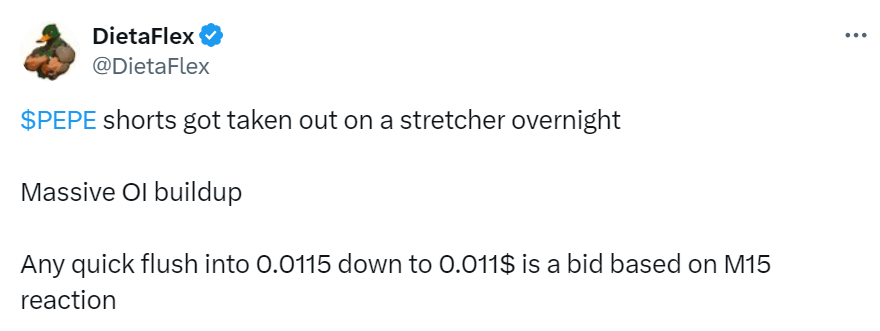
This surge comes on the heels of a dramatic overnight development where $PEPE shorts were metaphorically “taken out on a stretcher” due to a massive Open Interest (OI) buildup. DietaFlex, an analyst, noted that any swift drop towards the $0.0115 to $0.011 range is seen as a buying opportunity, supported by a notable reaction observed on the M15 timeframe.
Charlie, an analyst, shared a technical analysis that revealed $PEPE has formed a rounded bottom pattern, a classic chart formation signaling a possible trend reversal. This pattern, characterized by a gradual decline followed by a gradual rise, suggests that selling pressures may have exhausted, paving the way for a new upward trajectory.
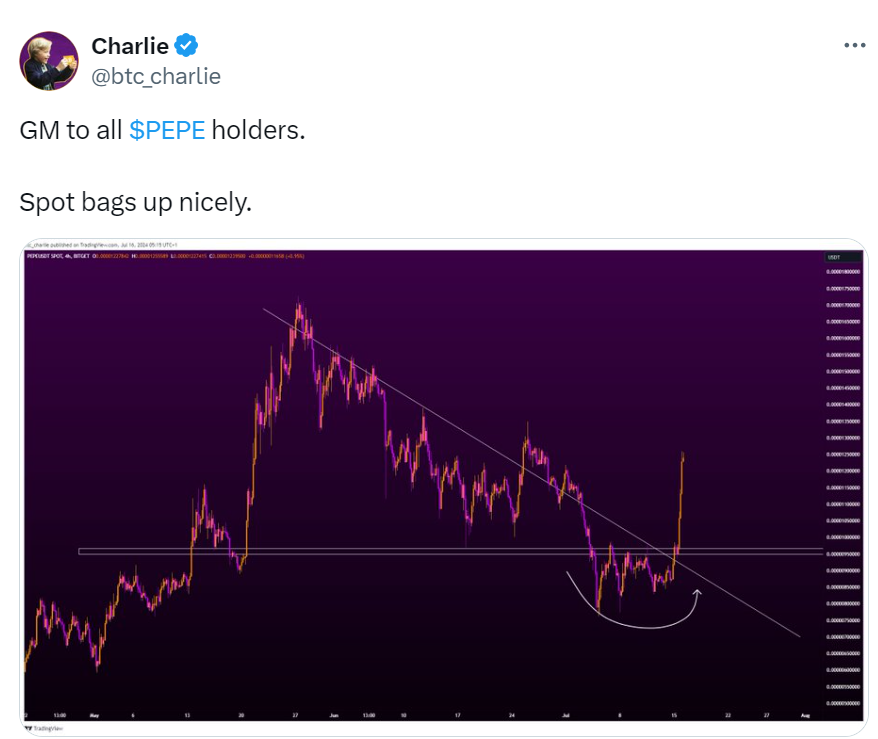
The confirmation of this pattern through sustained price action above key resistance levels further strengthens the bullish case for $PEPE in the short to medium term. Recent price movements have identified crucial support around $0.0000095 and $0.0000075, levels from which the asset has bounced decisively in recent trading sessions.

On the upside, resistance is seen near $0.0000125, where the current surge is testing its strength. A decisive breach above this resistance could potentially open up further upside targets for the asset.
PEPE Set for Major Surge: Analyst Predicts Bullish Wave Amid Huge TransferAs further noted by Crypto Free Signals, investors and traders alike are now eyeing potential entry points, particularly after the recent bounce from local trendlines.
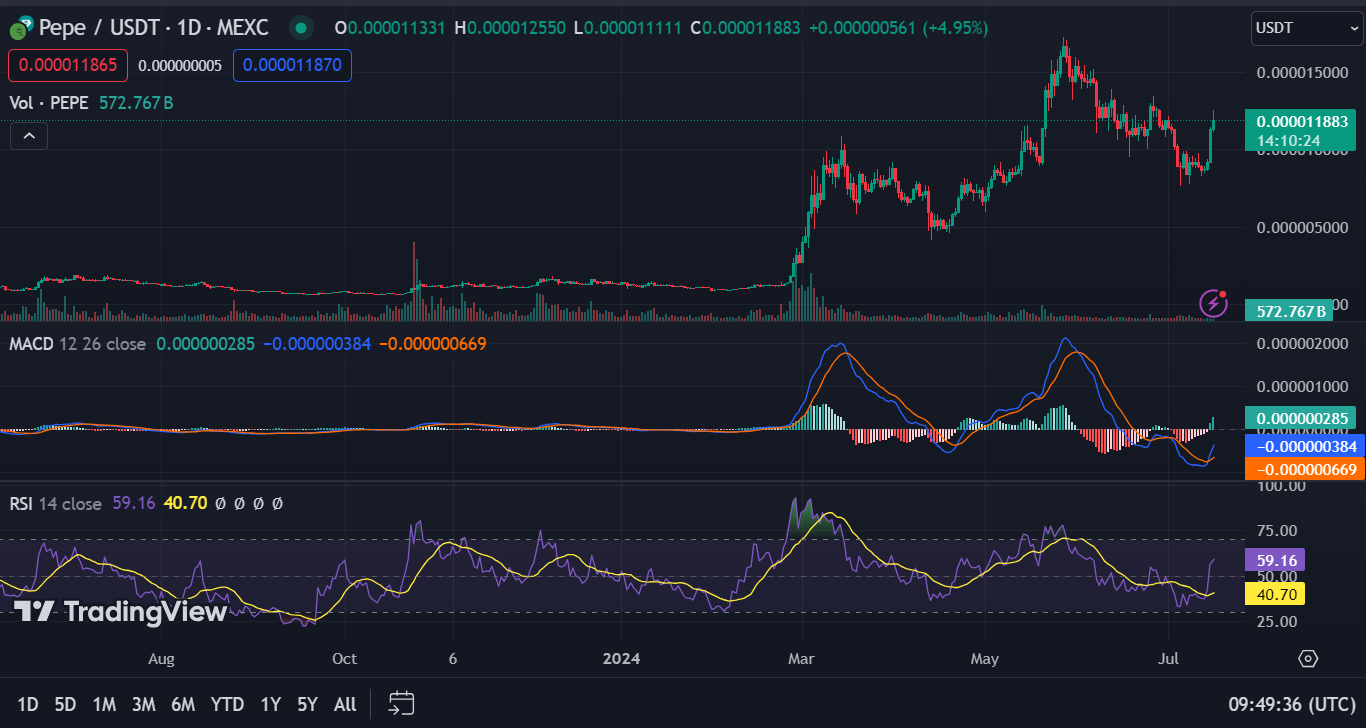
Market indicators such as the 1-day RSI reading of 59.00 and the MACD trading above the signal line suggest a balanced market sentiment without extreme overbought conditions, yet indicating positive momentum.