
Pepe ($PEPE) has demonstrated notable relative strength this morning as highlighted by Charlie, an analyst. The 15-minute timeframe reveals critical support and resistance levels. A detailed analysis provides insights into the price trend and potential future movements.

The key support levels for $PEPE are crucial in maintaining its upward trend. The ascending trendline support begins from the bottom left corner of the chart, indicating a robust upward support line.
This line has proven strong, with the price consistently bouncing off it multiple times. Additionally, there is horizontal support around the $0.0000120000 level, where the price has previously rebounded, reinforcing its significance.
On the resistance side, a key horizontal resistance level is identified around $0.0000126000. The price has faced rejection at this level several times, indicating strong resistance. Furthermore, the price action forms an ascending triangle pattern, characterized by rising support levels and a relatively flat resistance level. This pattern typically suggests a potential bullish breakout if the resistance is breached.
DOGE And PEPE Witness Strong Market Recovery, Analysts OptimisticThe ascending triangle pattern is usually considered a bullish continuation pattern. The rising support trendline indicates increasing buying pressure, while the horizontal resistance suggests sellers are defending that level.

A breakout above the horizontal resistance line can signal a strong bullish move. Currently, the price is consolidating within the ascending triangle, testing the resistance level multiple times. This repeated testing weakens the resistance, increasing the likelihood of a breakout.
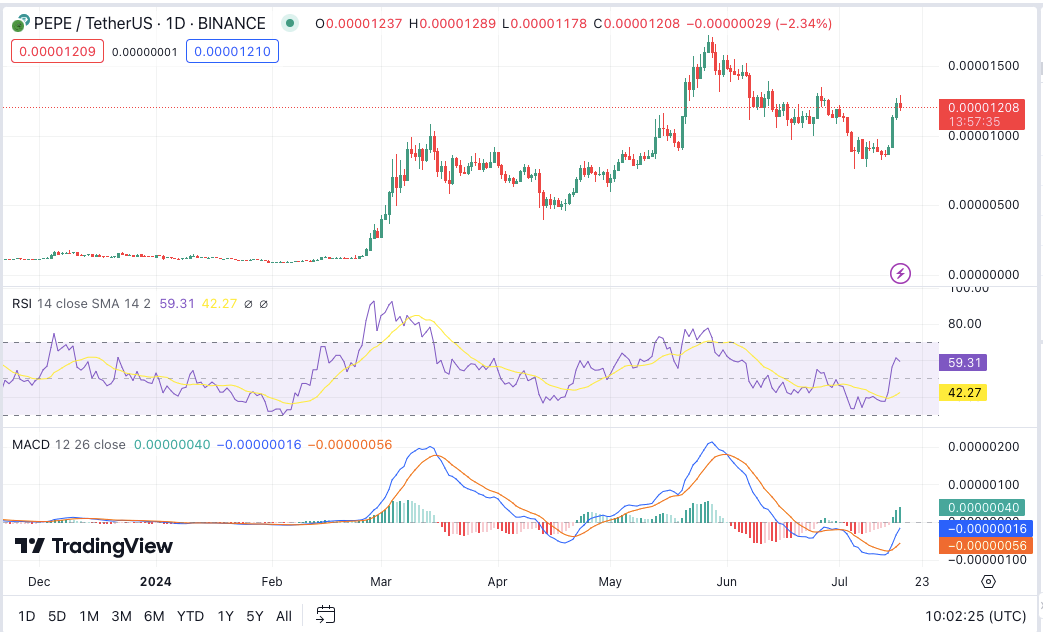
The live Pepe price at press time is $0.0000119, with a 24-hour trading volume of $1,720,253,027. Pepe is down 0.89% in the last 24 hours. On the 1-day timeframe, the RSI reads 59.40, indicating that the asset may be approaching overbought territory but is not yet in a strong uptrend. Additionally, the 1-day MACD is trading above the signal line, suggesting that there may be some bullish momentum building, although it is not yet confirmed.