
The latest chart analysis highlights a significant trend in the altcoin market. According to Cryptollica, altcoins are approaching a critical resistance level. This level, if breached, could signal the start of a major bull market in 2024. This analysis is based on the relationship between “OTHERS” and the M1 Money Supply, showing historical patterns and potential future movements.
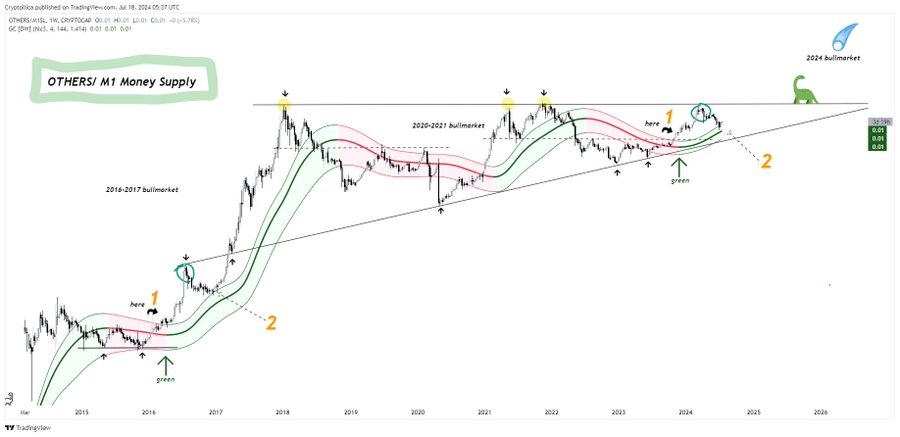
The chart identifies two significant bull markets in the past. The first occurred in 2016-2017, and the second in 2020-2021. These periods saw substantial increases in the value of altcoins. Both bull markets are marked by strong upward trends. Additionally, they showcase the cyclical nature of the market.
A long-term ascending trend line starts from 2015. This line indicates a general upward trend over the years. Several resistance levels have been tested multiple times during different bull markets. These resistance levels are crucial as they often determine whether the market will break out into a new phase. Moreover, support levels have been identified. These levels serve as safety nets during market corrections.
Mikybull Crypto’s Chart Analysis Shows Altcoin Season Might Not Be OverThe chart also features moving averages represented by green and red bands. These bands indicate trends and potential reversal points. Green bands show periods of bullish momentum. Conversely, red bands suggest corrective or bearish phases. The convergence and divergence of these bands provide insights into market momentum.
Currently, the market is testing a significant resistance level. If this resistance is broken, it could signal the start of a new bull market. The chart highlights the present market situation. This indicates the market might be at the beginning of a new bullish phase or facing resistance before breaking out.
Cryptollica’s chart projection suggests a potential bull market in 2024. The chart shows historical patterns of significant bull markets followed by corrective phases. The moving averages and support levels add context to potential market movements. They suggest a period of consolidation with bullish potential. Therefore, traders and investors should consider these insights for making informed decisions.