
The XRP Ledger demonstrates substantial growth in on-chain activity. According to data from the behavioral analysis platform Santiment, daily operations within the network sharply increased. On July 18, 2024, the ledger saw a record number of active addresses, totaling 36,111. This represents a key milestone in user participation and signals a robust expansion of the network.
In addition to the surge in active addresses, there was a remarkable rise in new XRP wallets. A total of 1,721 wallets were established on the same day, marking the highest number of creations since late March. This spike in wallet openings highlights a burgeoning interest from traders and investors keen on engaging with the XRPL.
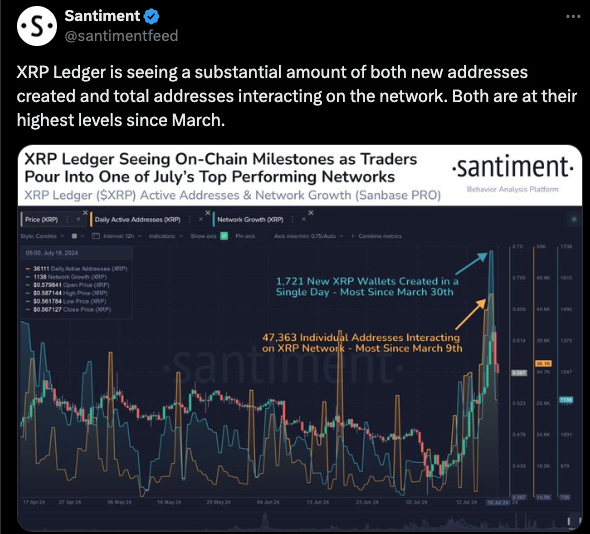
Moreover, the XRP Ledger experienced significant interactions across its network. On July 18, an impressive 47,363 individual addresses were active, the highest since early March. Such high engagement levels indicate increased transactions and general interactions, vital signs of a thriving network.
Over the past 24 hours, XRP has experienced a notable decrease of 4.95% in its price, currently standing at $0.5561. This downturn is part of a broader decline observed in the cryptocurrency market, with XRP’s market capitalization dropping by 5% to $31,093,013,640.
XRP’s Golden Cross Signals A Breakout to $20; Analysts SayAlongside the price drop, there has also been a notable decline in the trading volume, which decreased by 35.58%, totaling $2,544,442,332. This reduction in trading volume may indicate a decrease in investor engagement and market activity at current price levels.
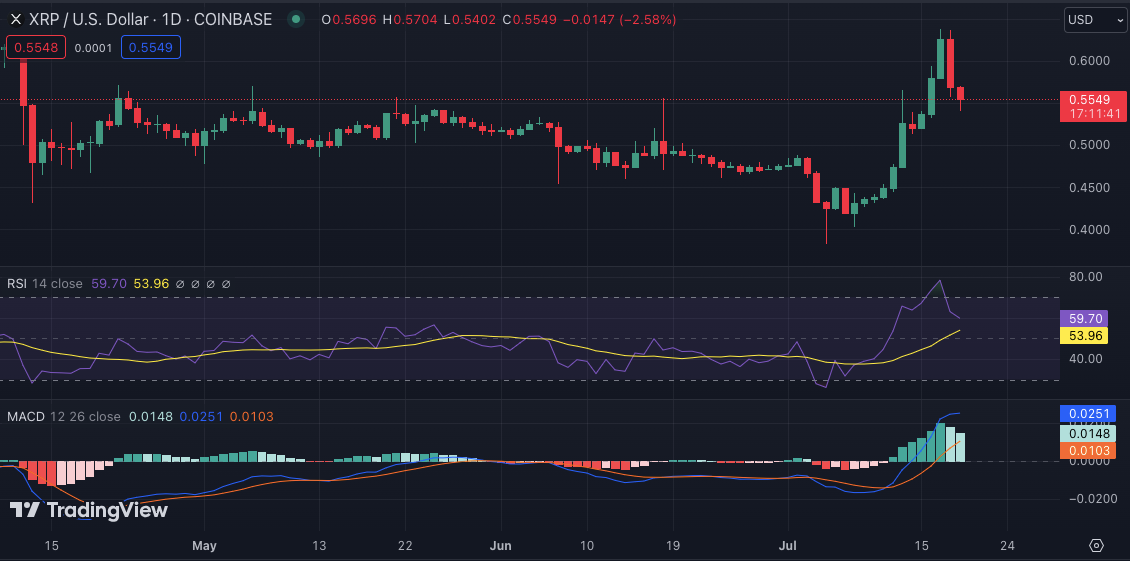
The Relative Strength Index (RSI) sits at 59.79, indicating that XRP is neither overbought nor oversold. This suggests a neutral market sentiment currently prevails, giving no strong directional bias. Meanwhile, the Moving Average Convergence Divergence (MACD) shows the MACD line (blue) recently crossing from below the signal line (orange), representing a bullish trend.