
Solana ($SOL) is currently displaying a bullish pennant pattern, a technical signal that suggests the cryptocurrency might be poised for further gains. This formation follows a strong upward movement and typically signals a continuation of the uptrend. As the price consolidates within the pennant structure, it’s essential to monitor the support and resistance levels closely to gauge potential future movements.
As highlighted by CryptoBusy, an analyst, the primary support for Solana is found between $153 and $160. Specifically, the $153.90 level aligns with the 0.618 Fibonacci retracement, marking a critical support during any pullbacks.

Should the price dip below this level, the next significant support is at $145.25, corresponding to the 0.786 Fibonacci retracement. Furthermore, the $134.24 level, representing the 1.0 Fibonacci retracement, offers additional support.
On the resistance front, Solana faces immediate resistance at $173.56, the 0.236 Fibonacci retracement level. This level has previously tested the price, resulting in some rejection. Above this, the next resistance target is $185.71, aligned with the 0.0 Fibonacci retracement level. Breaking through this resistance could lead to a new high for Solana.
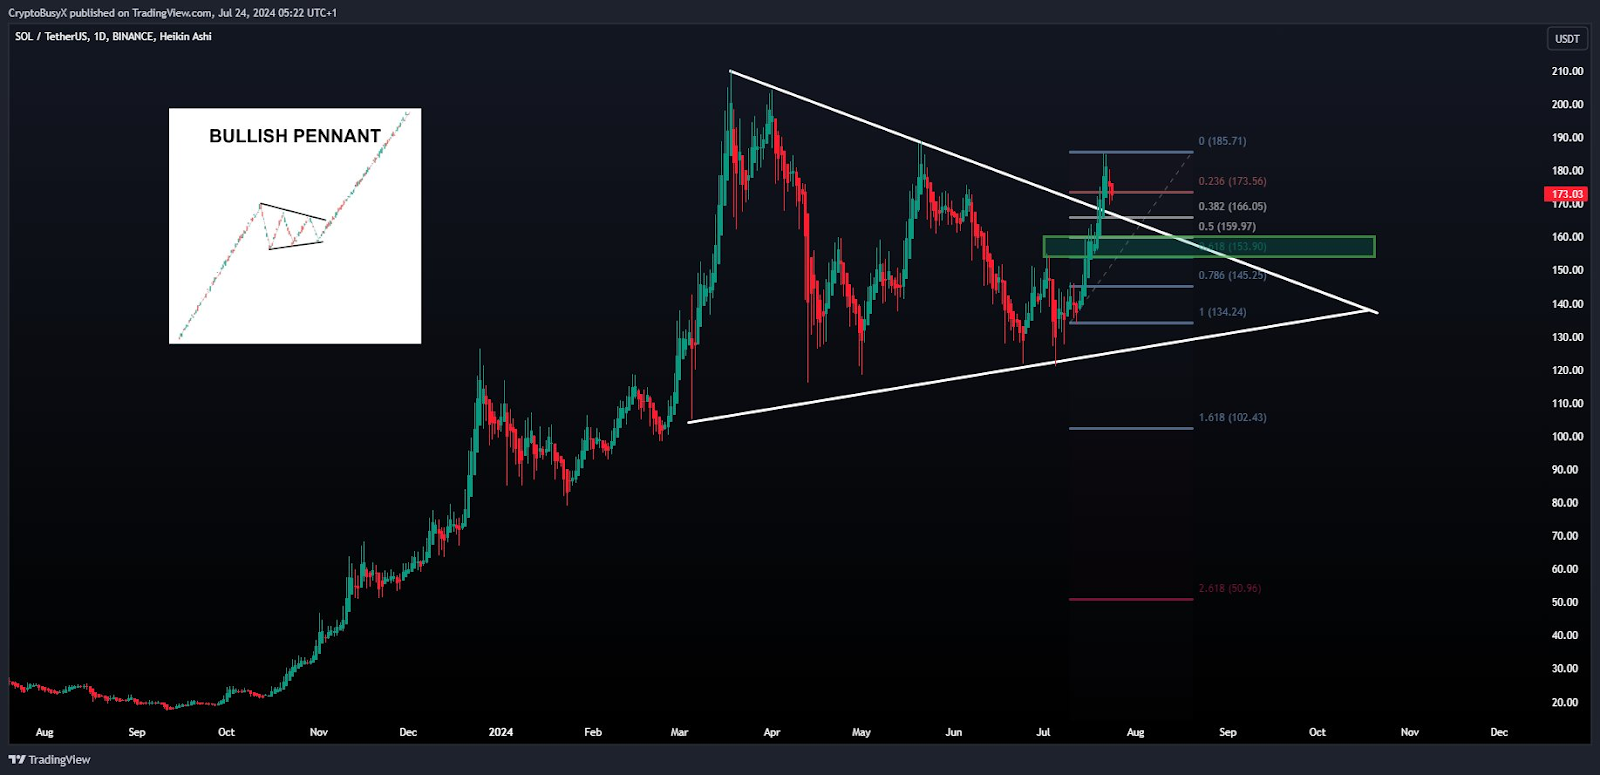
Recent price action shows Solana has corrected from a high near $185 but continues to trade within the pennant. This consolidation phase suggests that the market might be accumulating before a significant breakout. A move above the upper trendline of the pennant could signal a continuation of the bullish trend, potentially driving the price towards previous highs and beyond.
As at press time, Solana is trading at $176.15, with a 24-hour trading volume of $3,025,695,158. The cryptocurrency has experienced a slight decline of 0.51% over the past 24 hours.
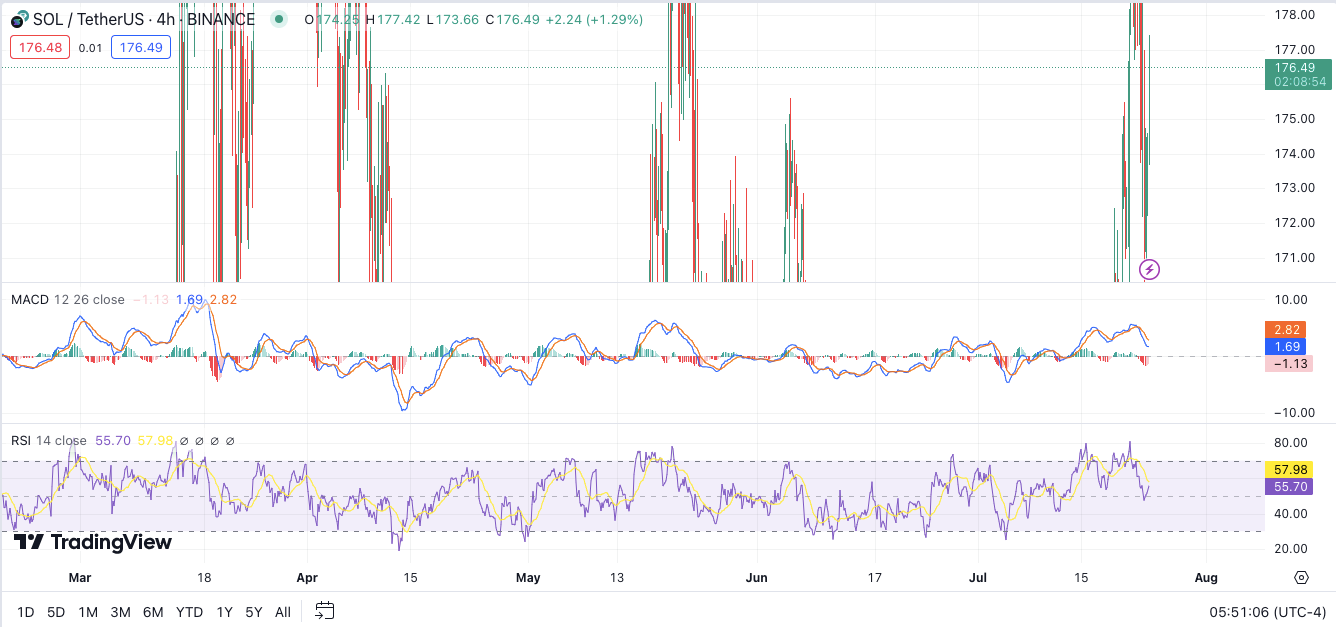
In the 4-hour chart, the RSI stands at 55.28, indicating a neutral market sentiment. This suggests that the price may undergo some consolidation before making any significant moves. Additionally, the 4-hour MACD is trading below the signal line, hinting at a possible bearish trend forming.