
Bitcoin is experiencing a period of high volatility as traders leverage positions amid a price dip. As highlighted by Ali Martinez, a top analyst, this activity has created a $30 million liquidation pool, with the price sitting at $63,800.
Further noted by Ali Martinez, the TD Sequential indicator is signaling a potential buy opportunity on the hourly Bitcoin chart, suggesting that a rebound might be on the horizon. The Bitcoin price chart against Tether on the 1-hour timeframe has shown notable trends and key levels.

The current trend is characterized by a sharp decline, highlighted by a large red candlestick, which suggests strong bearish sentiment. This downward movement has placed Bitcoin below its moving average, which is also trending downward, reinforcing the bearish outlook.
Candlestick patterns on the chart reveal that the price saw some buying pressure with green candles before the recent sell-off. This sell-off is marked by a large red candle followed by a smaller one, indicating continued bearish momentum. The situation creates a critical juncture for Bitcoin as traders watch for the next significant move.
In terms of support and resistance, Bitcoin faces a resistance zone between $64,950 and $65,250. The price fell sharply after reaching these levels, indicating a challenge for any potential rebound.
On the downside, there is a support level between $63,900 and $63,700. The wick of the large red candle approached this level, suggesting potential buying interest from traders looking to support the price.

If the support holds, Bitcoin might attempt to bounce back towards the resistance zone around $64,950. However, if the support fails, a break below $63,700 could lead to further declines.
Bitcoin Tests Key Support at $67,500 Amid Bullish Patterns, Can it break $74K?At press time, Bitcoin is trading at $64,251.75, with a 24-hour trading volume of over $33.6 billion, reflecting a decrease of 2.22% in the last day. Despite the recent dip, the 1-day Relative Strength Index (RSI) stands at 52.39, indicating a neutral market that is neither overbought nor oversold.
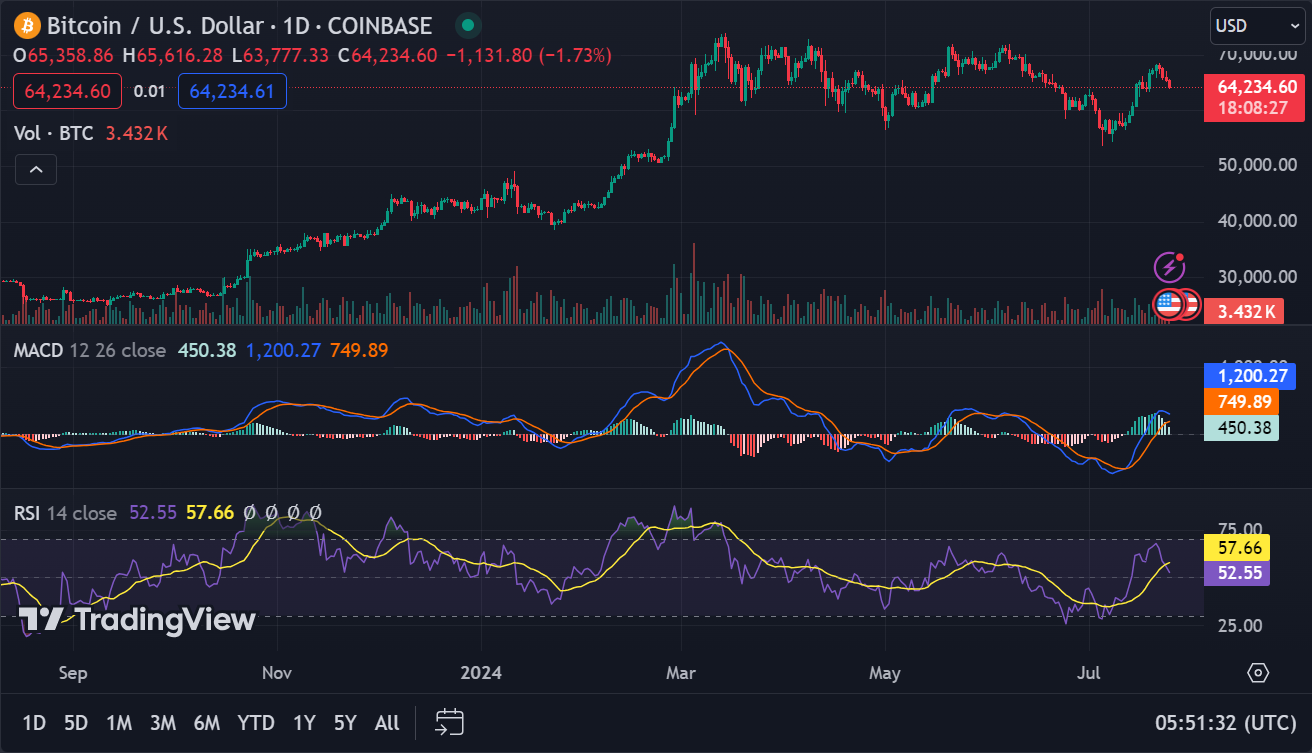
Additionally, the 1-day MACD is trading above the signal line, suggesting short-term bullish momentum that might support a price rebound.