The recent Elliott Wave analysis of XRP presents an intriguing picture for investors. According to Charting Guy’s two-day chart, XRP has completed Wave 2 with a notable drop to $0.3825 on July 5. This development sets the stage for Wave 3, which is typically characterized by significant bullish momentum.
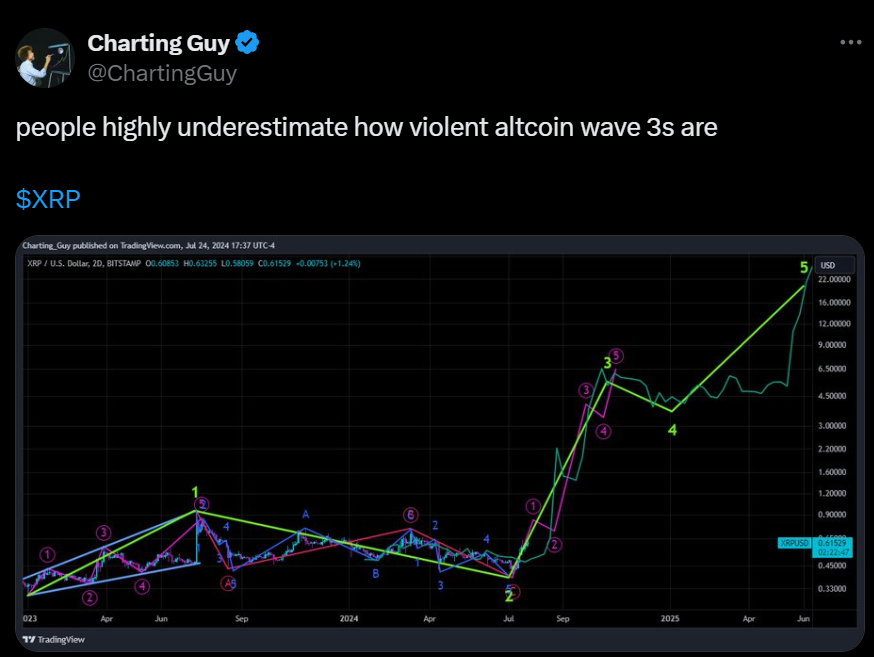
Charting Guy’s projections suggest that Wave 3 could drive XRP’s price up to $6. However, historical predictions and current analysis present a range of potential targets.
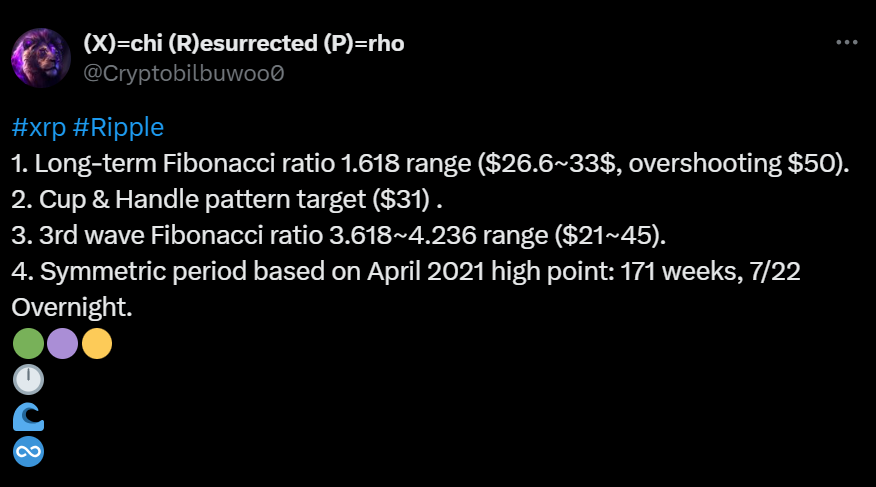
Analysts Insight: XRP’s 2017-Style Surge Begins – What’s Next?In the past, analysts have been optimistic about XRP’s performance during Wave 3. For instance, CryptoBull forecasted a potential peak of $27 for XRP during this wave last December. More recently, Cryptobilbuwoo suggested that Wave 3 could push XRP into a price range between $21 and $45. This range reflects varying levels of bullish sentiment in the market.
Following the anticipated bullish Wave 3, Charting Guy predicts a corrective Wave 4. This wave might involve price consolidation or a minor pullback. Despite this temporary correction, the overall bullish trend is expected to persist.
The final leg, Wave 5, could drive XRP prices to as high as $22. However, Charting Guy points out that while $20 represents an optimistic target, a more realistic price goal for Wave 5 might be between $8 and $13.
As per analysis by MikybullCrypto, an analyst, turning to XRP’s performance relative to Bitcoin, the XRP/BTC weekly chart reveals several key technical patterns. A notable double bottom formation began around early 2021.
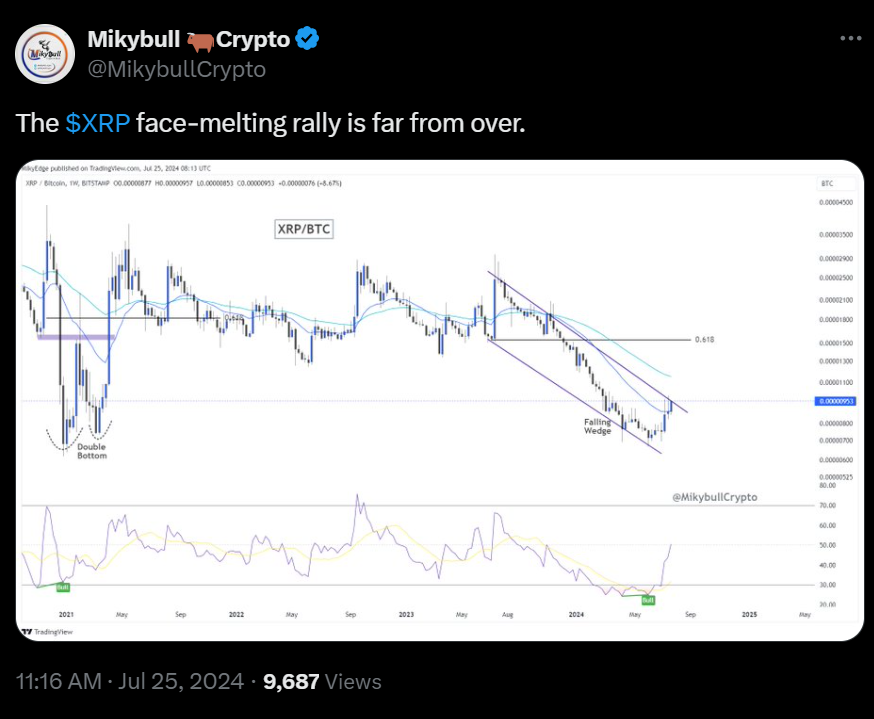
This pattern often signals a strong bullish reversal, indicating the end of a downtrend. More recently, the chart displays a falling wedge pattern, which also suggests potential upward movement following a breakout.
The 0.00000800 BTC level, marking the lower boundary of the falling wedge, has provided significant support during the downtrend. Additionally, the 0.00000750 BTC level, representing the bottom of the double bottom pattern, has been a reliable historical support level.
The upper boundary of the falling wedge, at 0.00001100 BTC, serves as immediate resistance. A breakout above this level could indicate a bullish reversal. Higher resistance levels include 0.00001800 BTC, corresponding to the 0.618 Fibonacci retracement level, and 0.00002500 BTC, reflecting previous price action peaks.
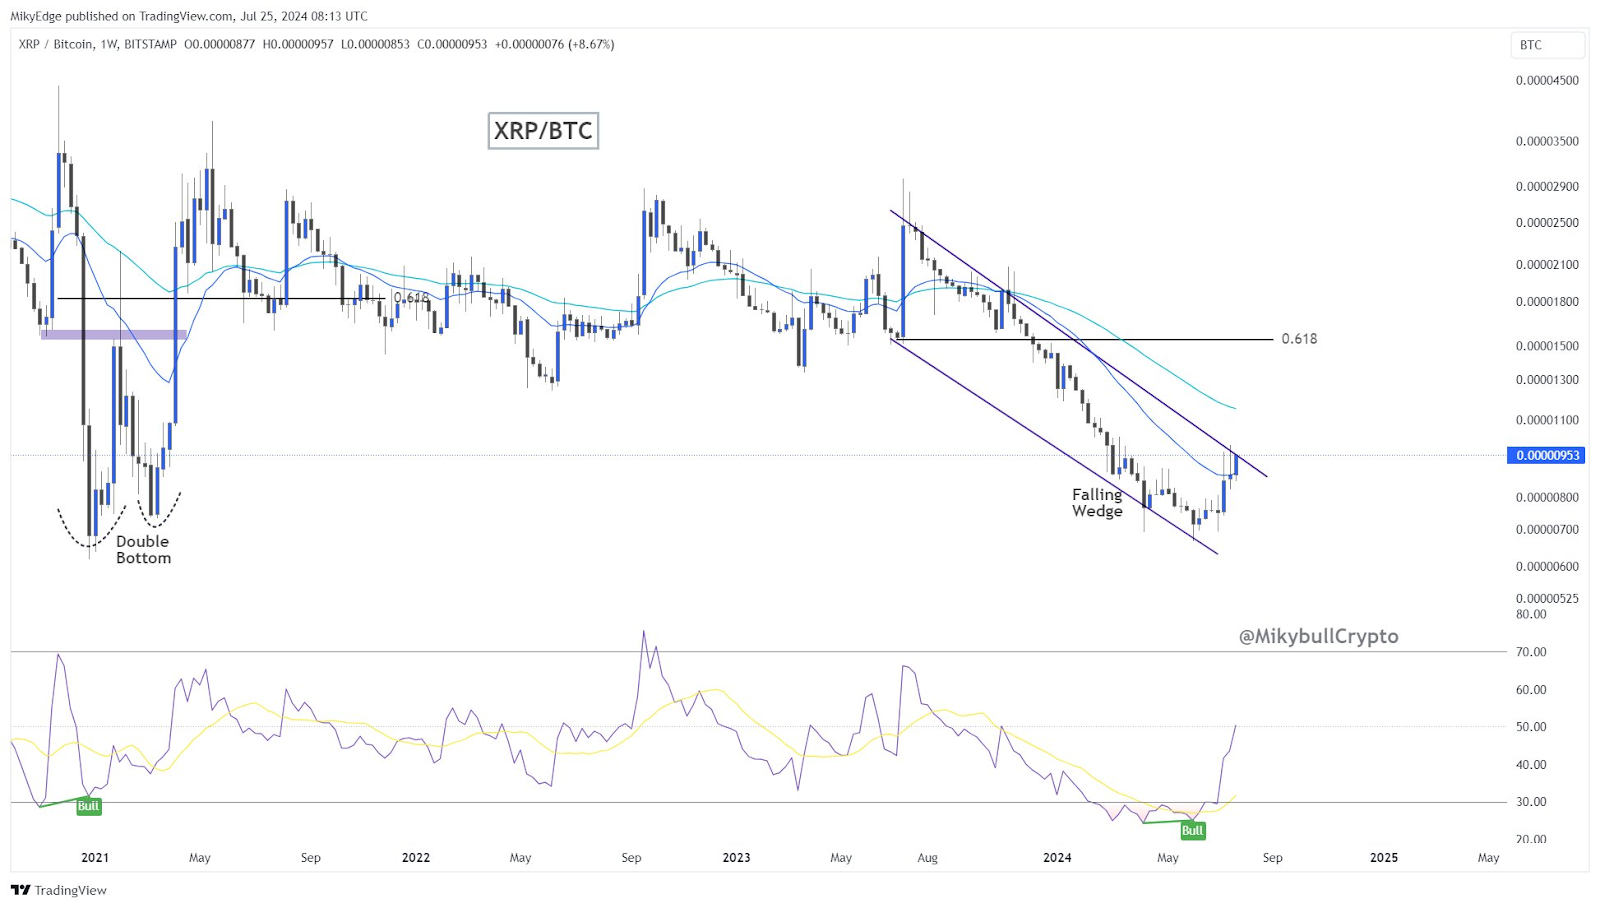
The price is approaching the 50-week moving average, which can act as a support or resistance level. The 200-week moving average offers a longer-term perspective, with a price crossing above this average signaling a strong bullish trend.
As at press time, XRP is trading at $0.606097, with a 24-hour trading volume of $2,158,872,754. Although XRP has declined by 1.94% in the last 24 hours.