
Chainlink ($LINK) is currently experiencing a buy signal according to the TD Sequential indicator on its 4-hour chart. According to Ali Martinez, a top analyst, the current price action shows a predominance of red candles, indicative of a bearish trend.
However, the appearance of the last two green candles might signal a potential reversal or consolidation phase. This shift could be a precursor to a bullish movement if the price breaks through key resistance levels.
Immediate support is observed at $12.600, a level where the price has previously shown resilience. If the price drops below this support, the next significant support is at $12.360.
On the resistance front, $13.050 serves as the immediate hurdle. The price has struggled to close above this level, highlighting its significance. Beyond this, the resistance at $13.400 represents a substantial barrier, aligning with previous highs and psychological thresholds. Successfully breaking through these resistance points could signal a bullish trend, driving the price higher.
Chainlink’s Exchange Supply Dips—Is a Bullish Surge on the Horizon?The recent green candles following a series of red ones could indicate a bullish reversal if they form a bullish engulfing pattern or a similar reversal formation. Additionally, the previous red candle had a long lower wick, suggesting buying interest at lower price levels.
However, the recent price action and consolidation around current levels could signal a reversal. To confirm this potential shift, the price needs to break above the immediate resistance at $13.050. A successful breach with strong volume might propel the price towards the next resistance at $13.400.
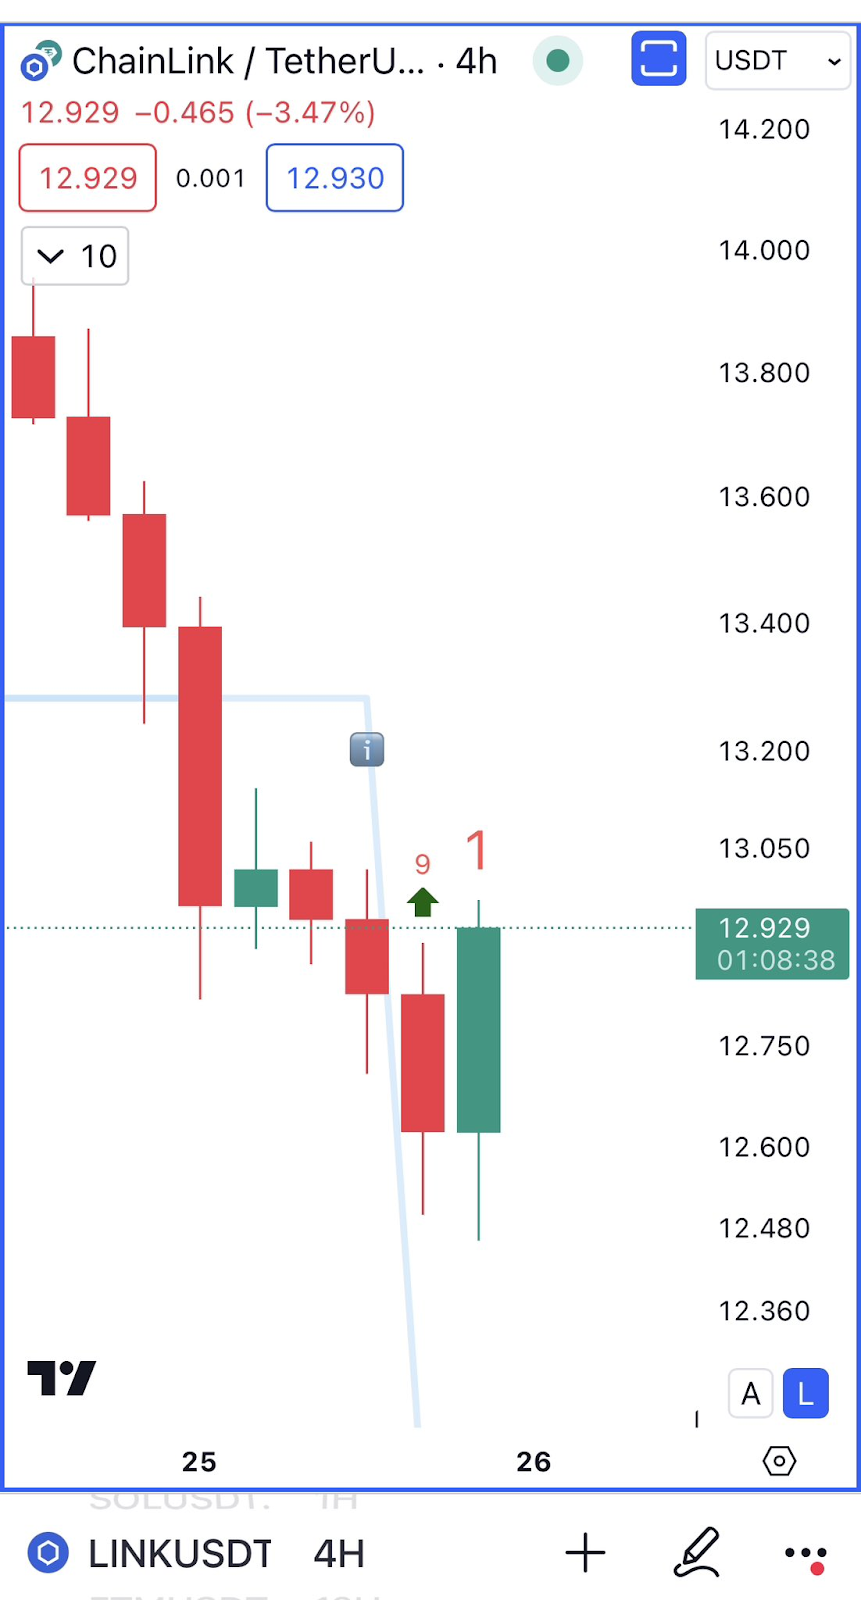
Conversely, if the price fails to surpass $13.050 and drops below the immediate support at $12.600, further declines could be expected. The next support level to monitor is $12.360, where additional selling pressure might emerge.
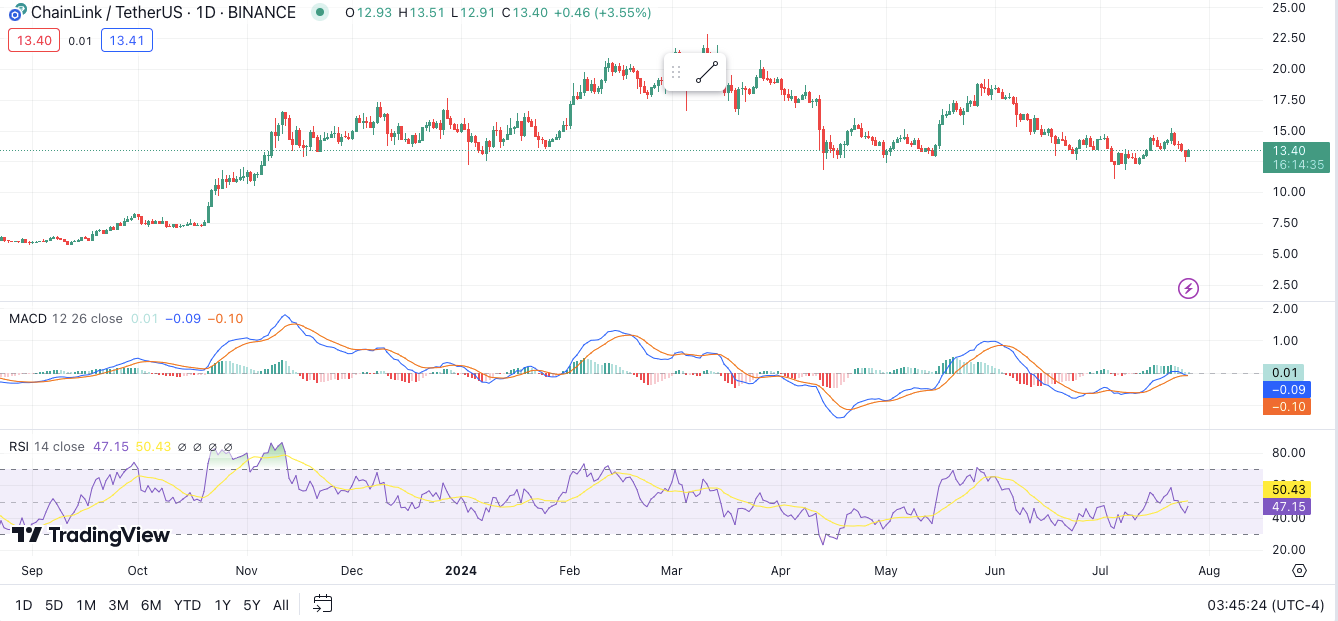
At press time, Chainlink is priced at $13.45, with a 24-hour trading volume of $274,845,199. The asset has seen a 2.81% increase in the past 24 hours. The 1-day RSI of 47.85 suggests that Chainlink is currently neither overbought nor oversold. Moreover, the 1-day MACD trading above the signal line indicates potential short-term bullish momentum.