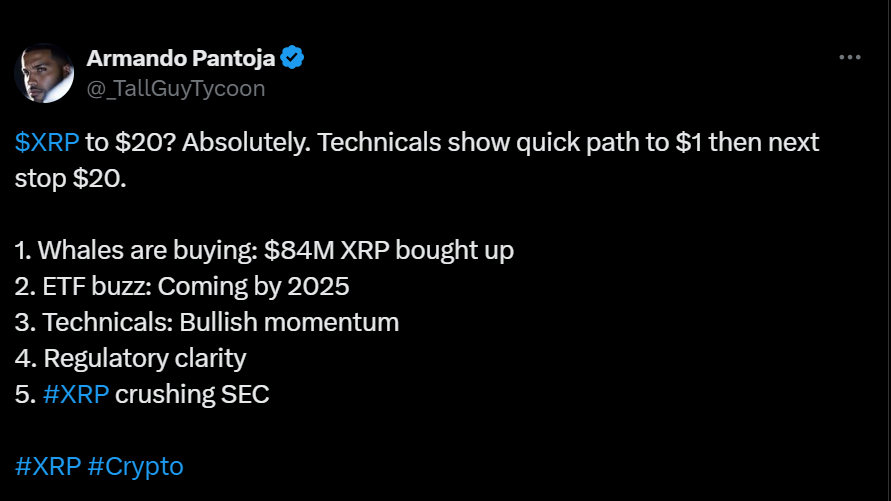
XRP has gained significant attention with predictions of a potential rise to $20, spurred by various factors as per Armando Pantoja, an analyst. Whales have accumulated $84 million worth of XRP, indicating strong institutional interest. Additionally, the anticipation of an ETF by 2025 is creating buzz around XRP. These elements, coupled with bullish technical indicators and growing regulatory clarity, suggest a positive outlook for the cryptocurrency.
Technically, XRP is showing bullish momentum on the XRP/USDT chart, with a price of $0.600773. The 9-day Simple Moving Average (SMA) is at $0.59560, indicating a short-term bullish trend as the current price is above this level.
Furthermore, the Bollinger Bands show that the price is near the upper band at $0.66979, signaling potential overbought conditions. The Relative Strength Index (RSI) is at 67.66, suggesting that the market is approaching overbought territory but hasn’t reached it yet. The chart reveals key support and resistance levels crucial for traders. Immediate resistance is around the $0.65000 level, where selling pressure was recently encountered. The upper Bollinger Band at $0.66979 aligns with recent highs, acting as another resistance level.
“Slim Chances” for Solana and XRP ETFs: BlackRock Crypto Chief’s ViewpointOn the support side, the immediate support is near the 9-day SMA at $0.59560, where the price found support recently. Secondary support is around $0.55000, a level where the price consolidated before its recent rally. If a significant downturn occurs, the lower Bollinger Band at $0.37685 would act as a strong support level.
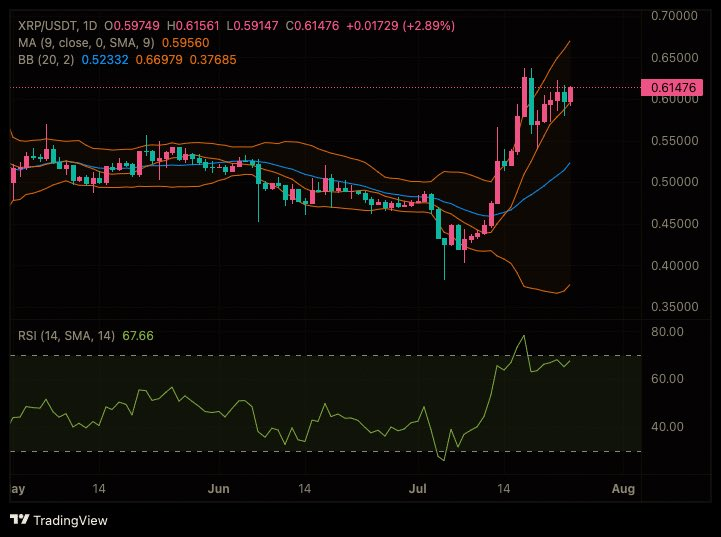
The price being above the 9-day SMA indicates upward momentum. Trading near the upper Bollinger Band also suggests strong upward pressure. However, caution is advised as the RSI approaches overbought levels, indicating potential for a pullback. Breaking through the recent resistance at $0.65000 is crucial for further upward movement.
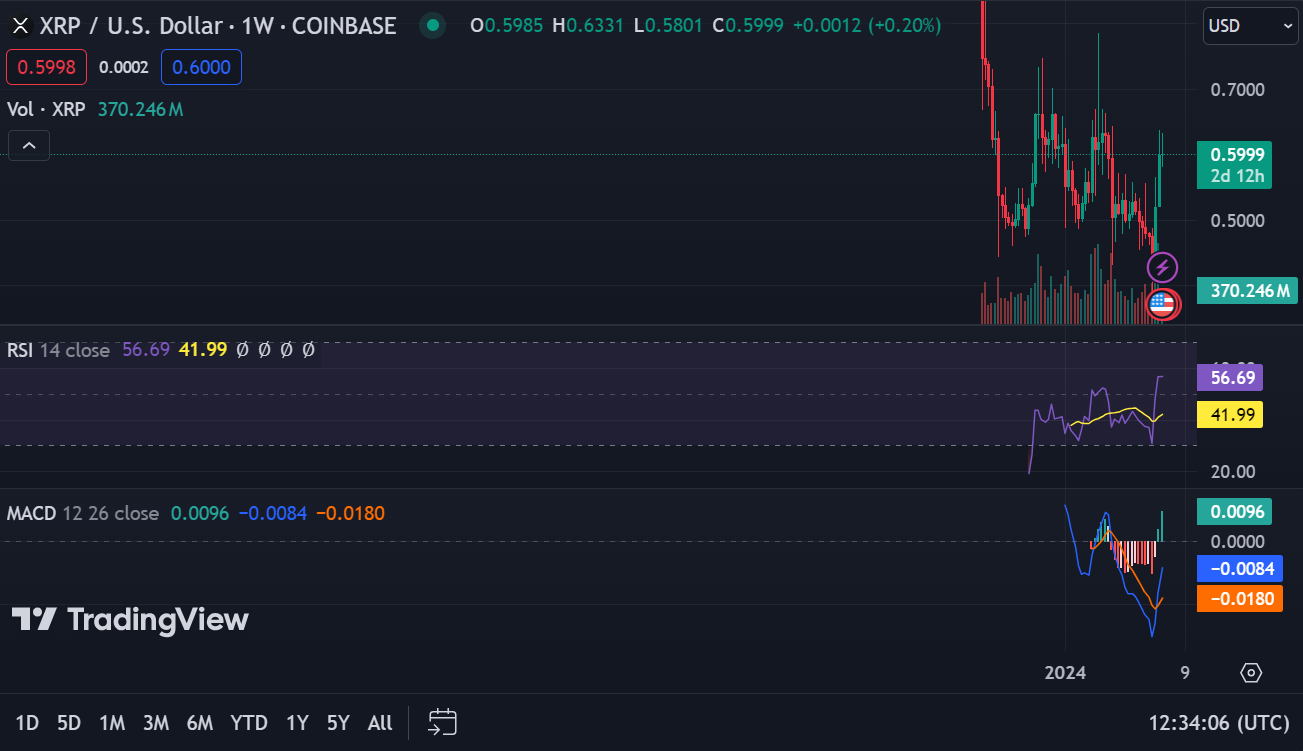
At the time of writing, XRP is trading at $0.600773 and despite being down 2.10% in the last 24 hours, the overall outlook remains positive. The live trading volume is $1,857,813,663, reflecting significant market activity. The 1-week RSI at 0.0083 suggests that XRP may be oversold, indicating potential for a bounce back in price. Moreover, the 1-week MACD trading above the signal line suggests a shift in momentum towards the upside.