
Dogecoin ($DOGE) appears to be gearing up for a significant bullish rally as highlighted by Clifton Fx, an analyst. Recent chart patterns and technical indicators suggest a positive shift.
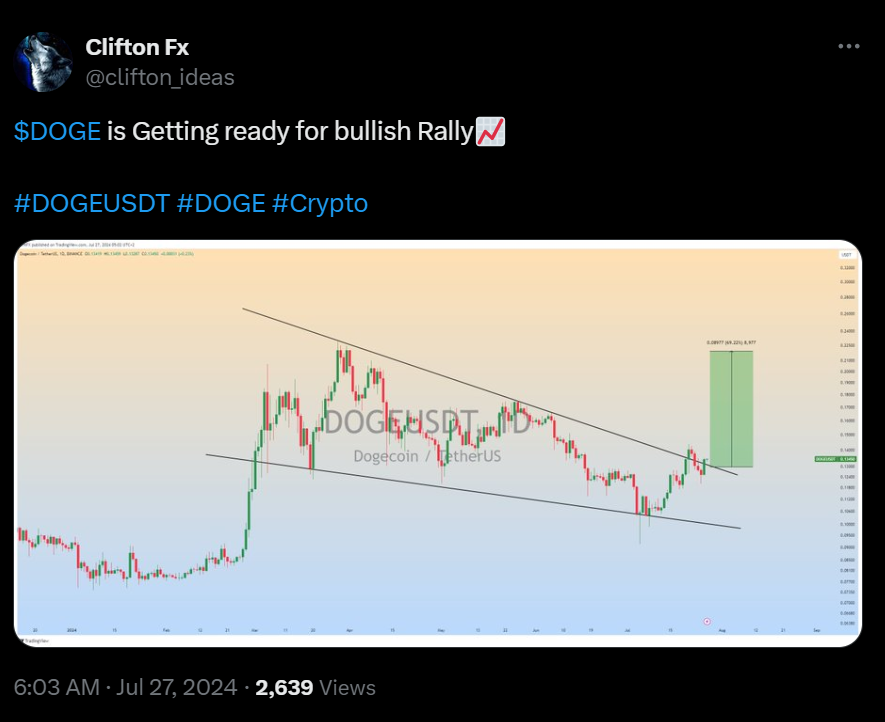
The breakout from this pattern suggests that Dogecoin could experience a substantial price increase. Based on Clifton Fx current projections, this could amount to a potential rise of approximately 69.22%, highlighting a strong opportunity for investors looking to capitalize on future gains.
Key support levels have emerged as critical markers for Dogecoin’s price movement. The $0.120 level has proven to be a significant support following the breakout. This price point provides a solid foundation for Dogecoin’s recent uptrend trajectory.
Bitcoin Tops $67K with Solana, Dogecoin, and Mumu the Bull Shining BrightAdditionally, the $0.110 level, which previously acted as support within the falling wedge pattern, could serve as a fallback point if the price revisits lower levels. Furthermore, the $0.100 mark is a psychological support zone and represents a key area of previous price consolidation.
On the resistance front, several levels could be pivotal in determining the coin’s short-term performance. The immediate resistance level is set at $0.140, which currently challenges the price.
Overcoming this barrier could pave the way for further gains. Following this, the $0.160 level stands as a significant resistance from previous price actions.
The $0.180 level represents the upper boundary of prior consolidation before the recent downtrend. As at press time, Dogecoin’s live price stood at $0.134329 with a 24-hour trading volume of $671,230,178. The coin has gained 4.06% in the last 24 hours.

Additionally, the 1-week Relative Strength Index (RSI) is at 51.07, indicating a neutral market position without signs of overbought or oversold conditions. However, the 1-week Moving Average Convergence Divergence (MACD) trading below the signal line suggests that a bearish trend may be forming in the short term.