
Solana (SOL) has made a remarkable recovery from its lows earlier this year, reaching impressive heights. As highlighted by analyst Satoshi Flipper, SOL initially hit bottom at $134 and has since been on a remarkable uptrend.
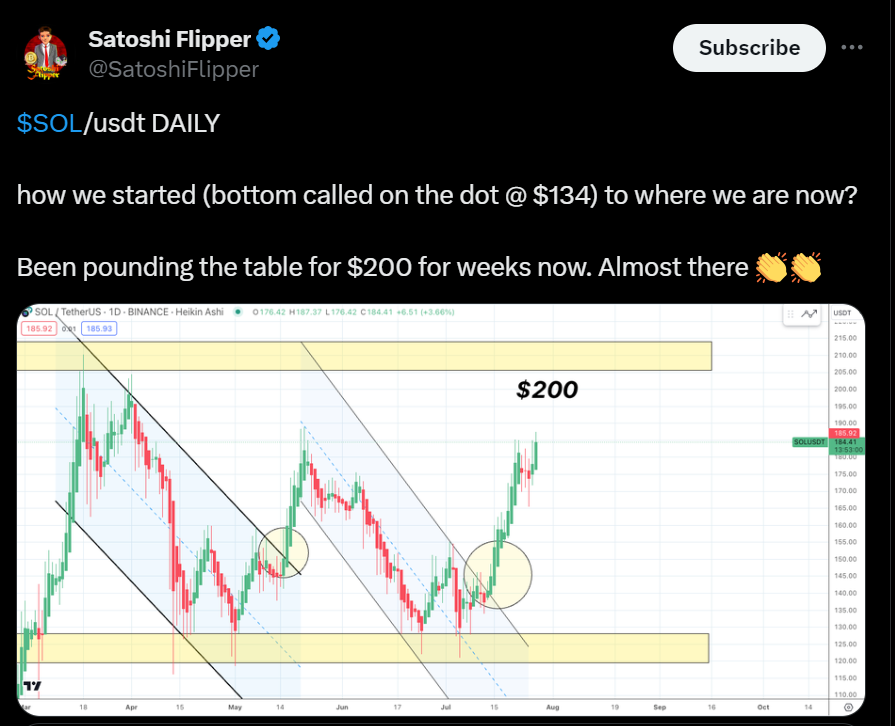
In the past few months, Solana’s price movement has been characterized by a significant transition from a downtrend to an uptrend. Initially, SOL was trading within a downward channel, evident from the parallel black lines on the chart. This downtrend persisted until mid-May when the price broke free from this bearish pattern. The breakout marked the start of an upward trend that continued through mid-July. At that point, SOL broke out from another downtrend channel, reinforcing the bullish momentum.
Layer 1 Dominance: Bitcoin, Ethereum, and Solana Drive Crypto Market ResurgenceCurrently, the price is approaching a critical juncture. Key support levels have been instrumental in shaping the current trend. A notable support zone around $125, highlighted on the chart, has been crucial. This level acted as a robust support area, with the price rebounding twice in May and July, forming a double bottom pattern. This pattern signifies strong buying interest and has been pivotal in the recent uptrend.

On the flip side, key resistance levels are now coming into play. The immediate resistance level is situated around $200. The price is nearing this zone and might face resistance here. Above $200, there is another resistance zone, marked by a yellow box extending up to $215. This upper resistance zone has previously shown strong resistance, making it a crucial level to watch. A significant breakout above $215 could indicate further bullish momentum and potentially higher price targets.

As of press time, the live price of Solana stands at $186.13, with a trading volume of $2,454,393,269. The asset has experienced a 4.43% increase in the last 24 hours. The 1-week RSI reads 62.32, indicating a neutral position. However, the 1-week MACD is trading below the signal line, suggesting a potential short-term bearish trend.