
Bitcoin’s current trajectory is capturing significant attention in the cryptocurrency market. At a price of $66,893.34 at press time, Bitcoin finds itself at a pivotal juncture. The cryptocurrency recently experienced a 3.80% drop in the last 24 hours, a movement that might appear unsettling but is a part of the broader market dynamics.
As highlighted by Captain Faibik, an analyst, this volatility comes alongside an intriguing technical setup as Bitcoin is poised within an ascending triangle pattern on the monthly timeframe. This pattern is a classic bullish signal, suggesting that Bitcoin may soon embark on a significant upward trend.

The ascending triangle pattern is characterized by a horizontal resistance level and an upward-sloping support trendline. For Bitcoin, this resistance is clearly marked around $66,658. The price has tested this level multiple times without a definitive breakout, indicating strong resistance. However, the persistent higher lows suggest growing bullish momentum. Hence, a breakout above this resistance could signal the beginning of a major bull run.
Analyzing the support structure, the ascending trendline is crucial. This line, which started around $3,000 in 2018, has consistently provided support. Currently, this trendline intersects around $30,000, serving as a dynamic safety net for any potential price retracements.
Hong Kong Lawmaker Advocates Bitcoin for Financial Reserves: ReportAs Bitcoin navigates its current levels, the trendline’s support becomes increasingly significant. It underscores the strength of the bullish trend and the potential for sustained upward movement. Looking forward, the immediate target following a confirmed breakout above $66,658 could be around $100,000. This target aligns with the height of the triangle pattern added to the breakout point.
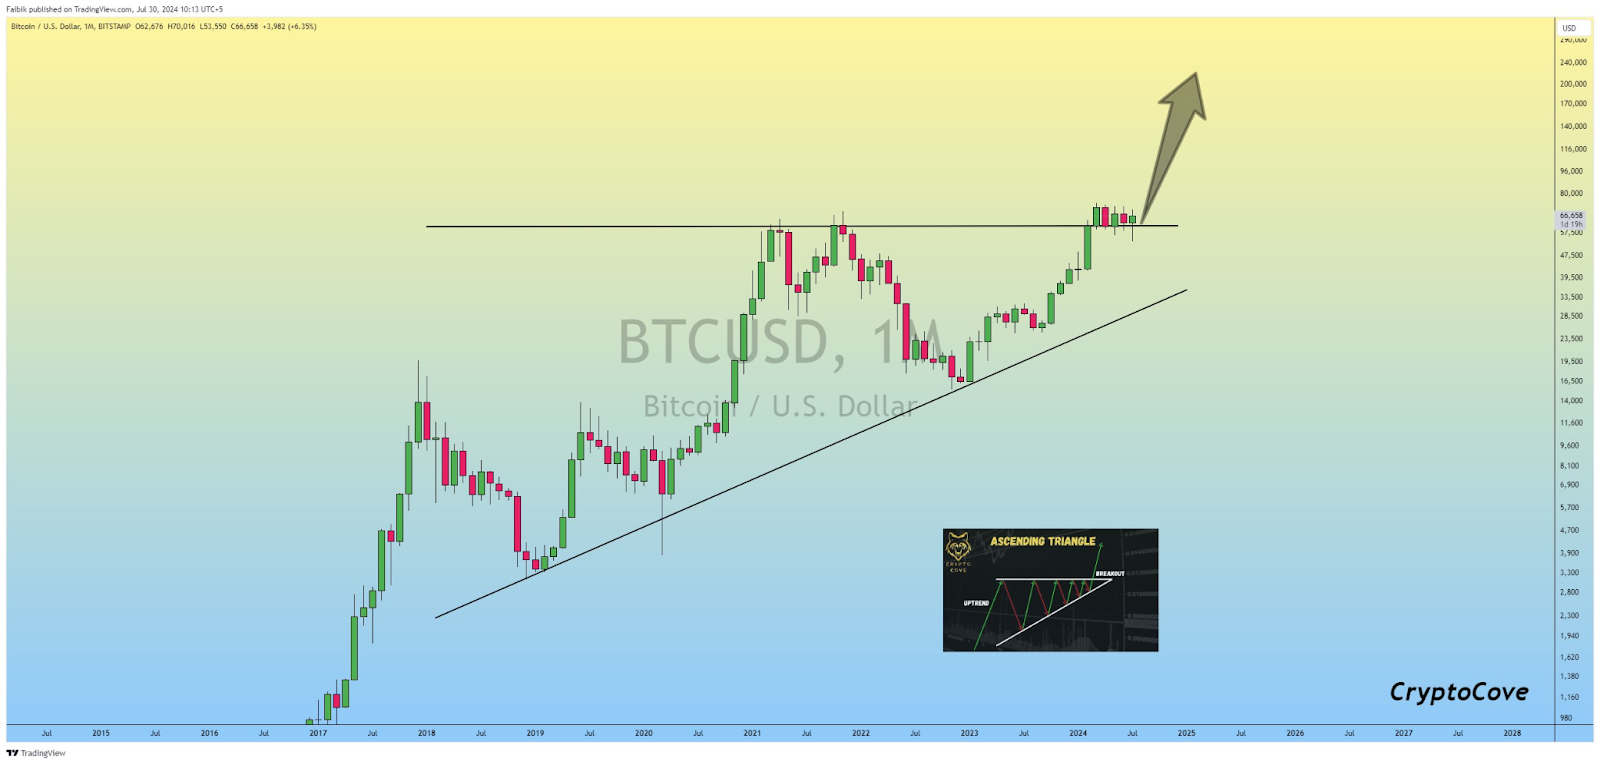
Consequently, this projection is grounded in technical analysis and market sentiment. In the long term, a target of $170,000 appears reasonable. This estimate reflects both historical performance and broader market conditions.
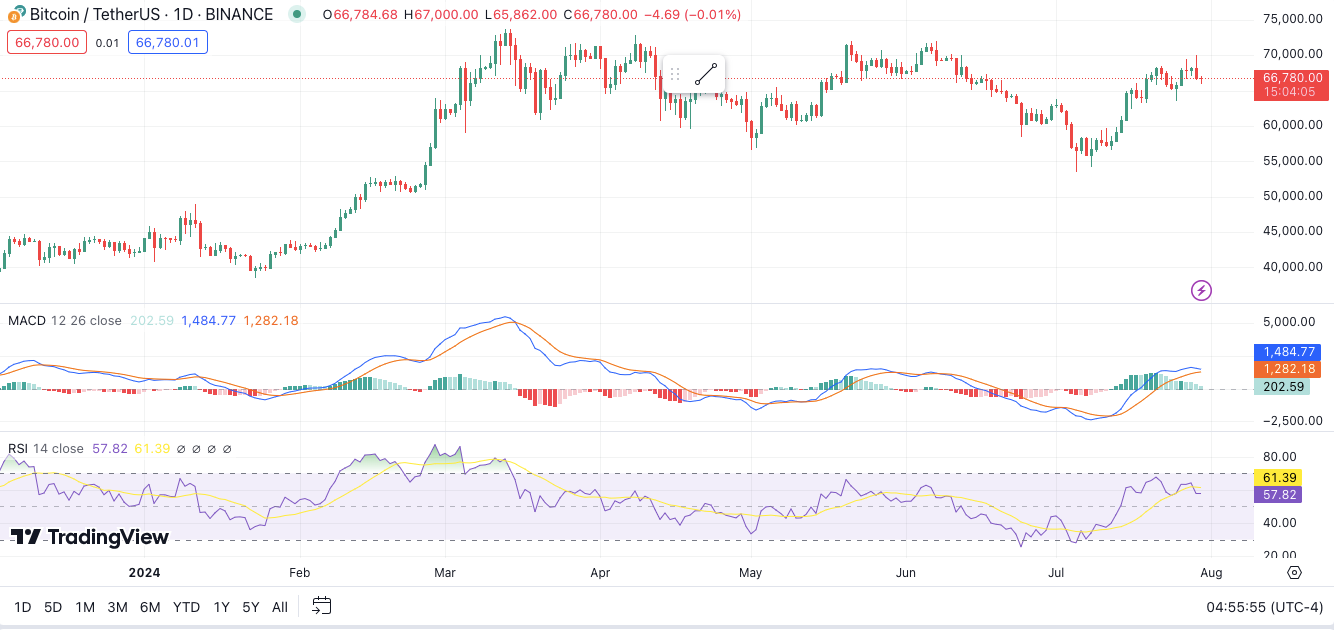
As per the chart, Bitcoin’s 1-day RSI stands at 58.30, placing it in a neutral position. This indicates neither overbought nor oversold conditions, suggesting a period of consolidation. Additionally, the 1-day MACD is trading above its signal line, reinforcing the possibility of a forthcoming price move.