
Bitcoin has been in a consolidation phase, forming a flag-like structure over the past few months. This pattern typically signals a continuation of the previous trend, suggesting a potential breakout. Jelle, a long-term investor, shared his insights on the X platform, emphasizing the significance of this formation and the possible six-figure target for Bitcoin.

The consolidation pattern within two parallel trendlines sloping downwards is identified as a bullish flag. The flagpole represents the preceding sharp rally, while the consolidation within the flag suggests a temporary pause before a potential continuation. Notably, the upper boundary of the flag acts as resistance, and the lower boundary provides support. A significant support zone exists around the $57,000 level, reinforcing the structure’s reliability.
A breakout above the upper trendline would signal a continuation of the bullish trend. Given the size of the flagpole and the bullish structure, a breakout could lead to significant upside potential. Jelle’s analysis highlights the importance of this pattern, suggesting a move towards a six-figure target for Bitcoin.
In a separate analysis, Jelle noted that Bitcoin recently took out all available downside liquidity and pushed back above the key support level. With 17 hours until the monthly close, the outlook for August appears positive. The chart indicates a significant support zone around the $55,000 to $57,000 range. Bitcoin’s price has rebounded from this support zone, indicating strong buying interest at these levels.

The recent price action suggests a sweep of downside liquidity, where Bitcoin’s price dipped below the key support to gather buy orders before pushing back up. This liquidity grab is often seen as a bullish signal, suggesting the exhaustion of selling pressure and the presence of strong demand. A strong close above the key support zone would reinforce the bullish sentiment and indicate potential for further upside in the coming month.
Bitcoin Signals a Bearish Reversal: Is a Dip to $62,000 Imminent?Another analyst, Crypto Rover, highlighted a bullish divergence between Bitcoin’s price action and the RSI indicator. This divergence occurs when the price forms lower lows while the RSI forms higher lows, indicating weakening selling pressure and a potential reversal to the upside. Bitcoin’s price has been making lower lows, but the recent candles show a potential rebound, aligned with the RSI forming higher lows.
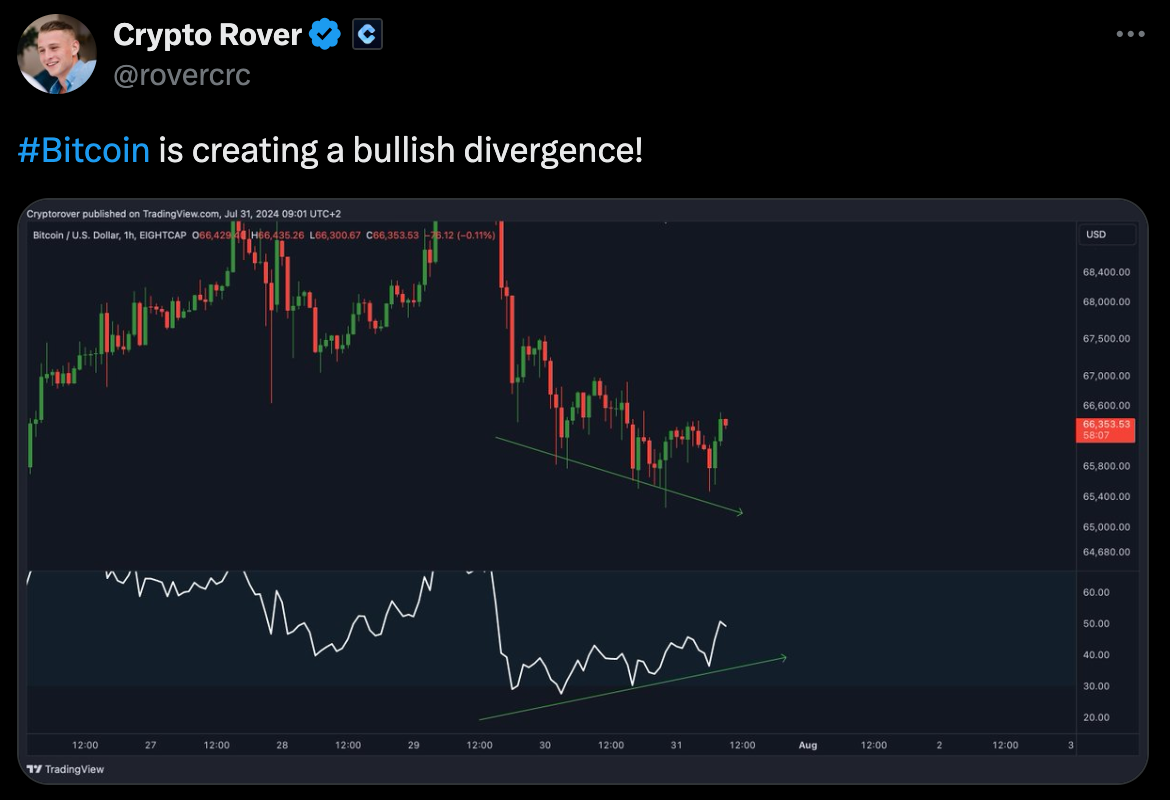
The RSI, a momentum indicator, measures the speed and change of price movements. The bullish divergence suggests that the momentum behind the price decrease is weakening, often preceding a price reversal. The area around $65,000 acts as a support level, where the price has bounced several times. Given the bullish divergence and the price action around the support level, there is a higher probability of a reversal to the upside.
At press time, Bitcoin’s price stands at $66,061.27, with a 24-hour trading volume of $28,145,145,981. This represents a -0.80% decline in the last 24 hours and a -0.60% decline over the past seven days. With a circulating supply of 20 million BTC, Bitcoin’s market cap is valued at BTC19,733,712.