
Bitcoin’s recent price action has captured the attention of traders, with a noticeable shift in the market’s dynamics. As of press time, Bitcoin (BTC) is trading at $64,290.78, reflecting a 2.75% decrease in the last 24 hours. The cryptocurrency’s current trajectory indicates a possible move to higher levels, with a target of $70,000 projected by top analyst Captain Faibik.

Currently, Bitcoin’s price is navigating within a descending channel on a 4-hour chart. This channel is defined by an upper resistance line and a lower support line, creating a confined downward-sloping range.
This pattern indicates that Bitcoin has been under downward pressure, with recent price action demonstrating a struggle to break above the upper resistance line. The recent peak around $69,000 marks a crucial resistance level, indicating that further upward movement will need to surpass this barrier to build momentum.
Conversely, the lower line of the channel serves as a crucial support level. The price has shown resilience at this boundary, bouncing back several times. The most recent interaction with this support was around $57,000, which could act as a pivotal level if the price retraces further.
Bitcoin Flag Pattern Hints at Possible Breakout Towards Six-Figure TargetGiven the current bearish phase within the channel, Bitcoin might test this support line again, potentially approaching the mid-$50,000 range if the downward momentum continues.
Looking ahead, the green trajectory illustrated in recent charts proposes a potential reversal of the current bearish trend. If Bitcoin can overcome the resistance of the upper channel line, there is a bullish projection targeting $70,000. This upward movement would necessitate substantial buying pressure and sustained bullish momentum.
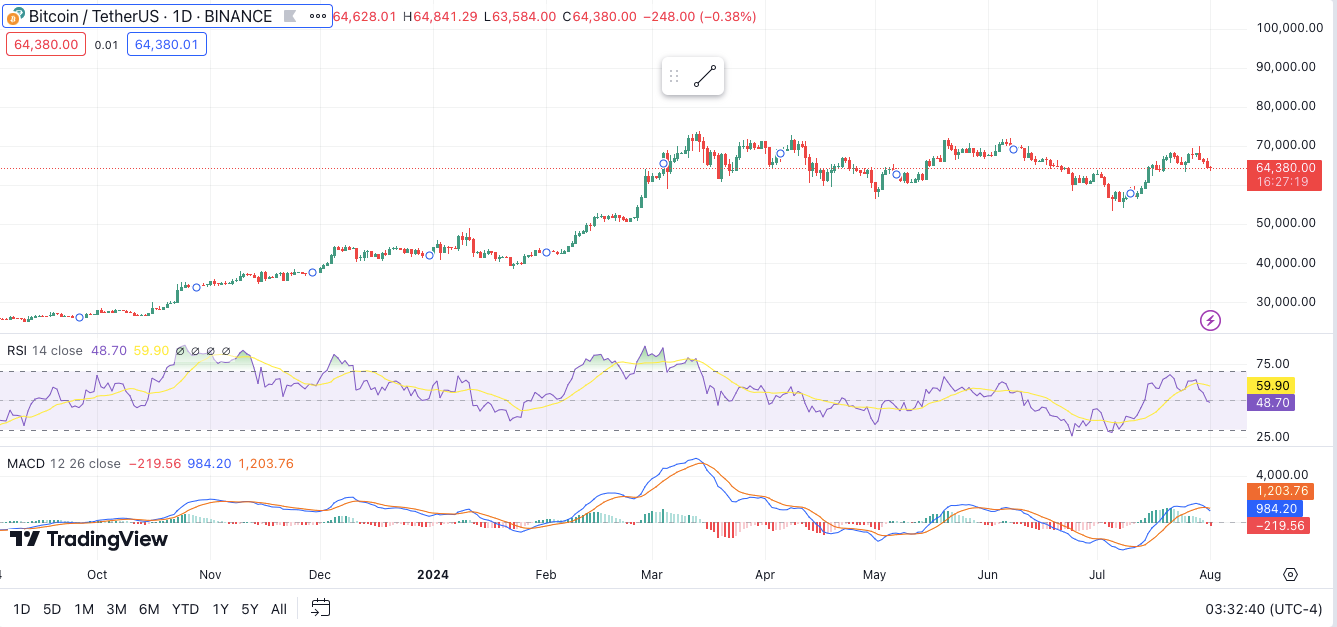
Additionally, the current RSI of 48.70 indicates that Bitcoin is neither overbought nor oversold, suggesting room for price fluctuations. The 1-day MACD, however, is trading below the signal line, hinting at a possible short-term bearish trend.