
Dogecoin (DOGE) might be on the brink of a major bullish breakout, potentially setting the stage for a rally larger than what was witnessed earlier this year. If current trends continue, the recent bearish retracement could present a prime buying opportunity for investors.
Earlier this year, Dogecoin demonstrated its potential with a notable rally, highlighting its capacity to attract substantial demand. However, in the past few months, DOGE has struggled to maintain its bullish momentum. This has led to some disillusionment among holders. Despite this, the current market conditions might be more favorable than they appear at first glance.
On the standard price chart by JAVON MARKS, an analyst, Dogecoin’s performance may seem lackluster. Yet, a closer look at the logarithmic chart reveals a different story. This chart suggests that Dogecoin is positioned within a significant breakout zone. Such technical signals imply that DOGE could experience a more substantial bull run than in previous cycles.
The log-based analysis hints at a potential 7200% rally, which could drive Dogecoin’s price as high as $10. While this projection might sound optimistic, it underscores the possibility of a dramatic shift in market dynamics.
At press time, Dogecoin’s price stands at $0.1141, reflecting a 1.57% decline over the past day. The market cap has also dropped by 1.56%, now at $16.59 billion. However, trading volume has increased by 7.62% in the last 24 hours, indicating a rise in trading activity. In terms of price action, Dogecoin has faced downward pressure recently. It began the day at approximately $0.116, peaked around the same level, and then fell to a low near $0.113. The price has since slightly rebounded to $0.114.
Dogecoin Bullish Signs Amid Whale Selling and Low VolumeKey resistance levels to watch include $0.116 and $0.118, where selling pressure is likely to intensify. On the support side, $0.113 and $0.110 are critical levels to monitor. These points could offer substantial buying interest and act as a cushion if the price continues to drop.
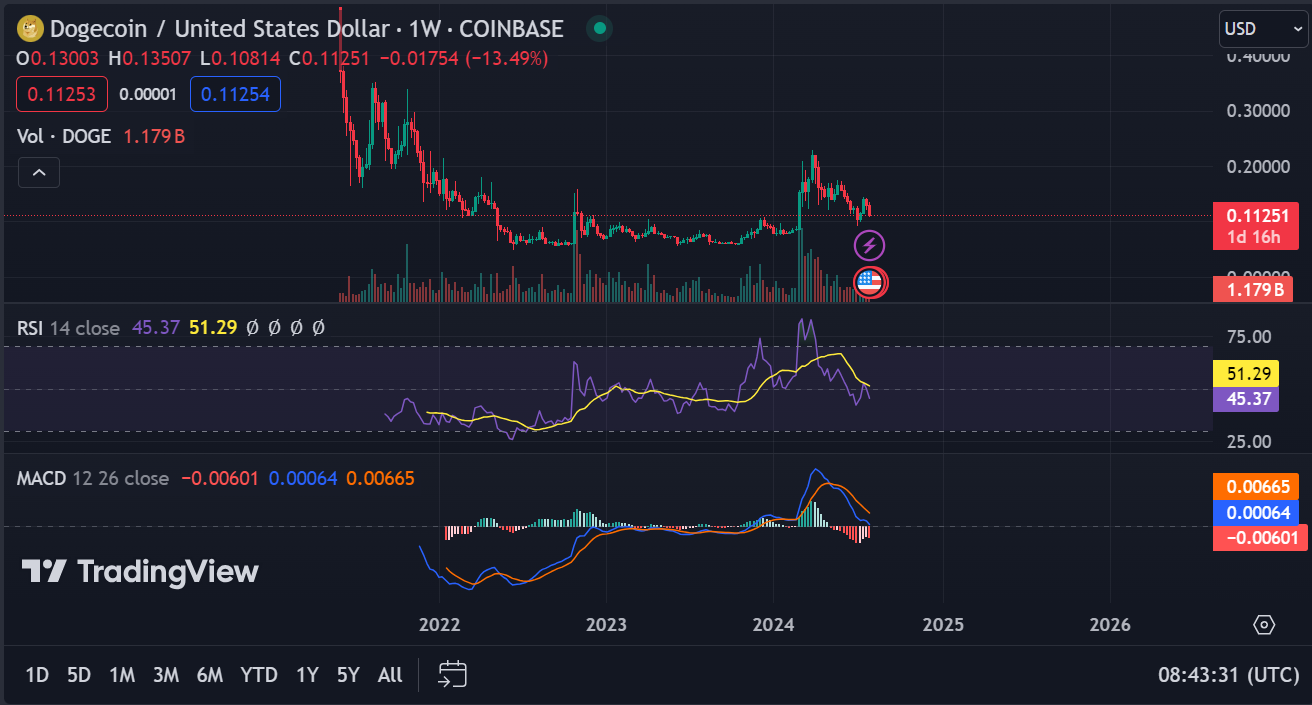
The 1-week Relative Strength Index (RSI) stands at 45.68, suggesting that Dogecoin might be nearing oversold conditions. Meanwhile, the 1-week Moving Average Convergence Divergence (MACD) is trading below the signal line, pointing to a potential bearish trend.