
The Solana-to-Ethereum (SOL/ETH) ratio is on the verge of reaching an all-time high for the fourth time in this cycle. This repeated testing of the peak highlights a crucial moment in the cryptocurrency market. As highlighted by Daan Crypto, an analyst, Solana’s performance has remained robust, while Ethereum has faced challenges, particularly due to significant ETHE outflows. Despite these struggles, Ethereum is likely to reclaim some market share as ETF flows improve in the future.
Examining recent price trends reveals that both Solana and Ethereum have been on a general downward trajectory. Ethereum’s decline, depicted in red, has been more gradual compared to Solana’s steeper drop, shown in blue. Solana’s price experienced a notable plunge before stabilizing, aligning somewhat with Ethereum’s trend. This pattern suggests that while both cryptocurrencies are losing value, Solana’s decline has been sharper.
FTX’s Secret Solana Holding: 8% of Supply in Hidden WalletsVolatility is another key factor differentiating the two cryptocurrencies. Solana has demonstrated greater volatility, characterized by sharp peaks and subsequent falls. Ethereum, on the other hand, has exhibited smoother movements with fewer abrupt changes. This contrast indicates that Solana’s price is more susceptible to sudden fluctuations, whereas Ethereum’s price movements are relatively steadier.
In terms of relative performance, Solana has experienced a greater overall decline compared to Ethereum. As of press time, Solana is priced at $150.07, down 7.86% in the last 24 hours, with a trading volume of approximately $4.5 billion. Ethereum, at $2,980.33, has seen a decrease of 5.49% over the same period, with a trading volume of around $22 billion. These figures reflect a more significant drop in Solana’s value compared to Ethereum’s.
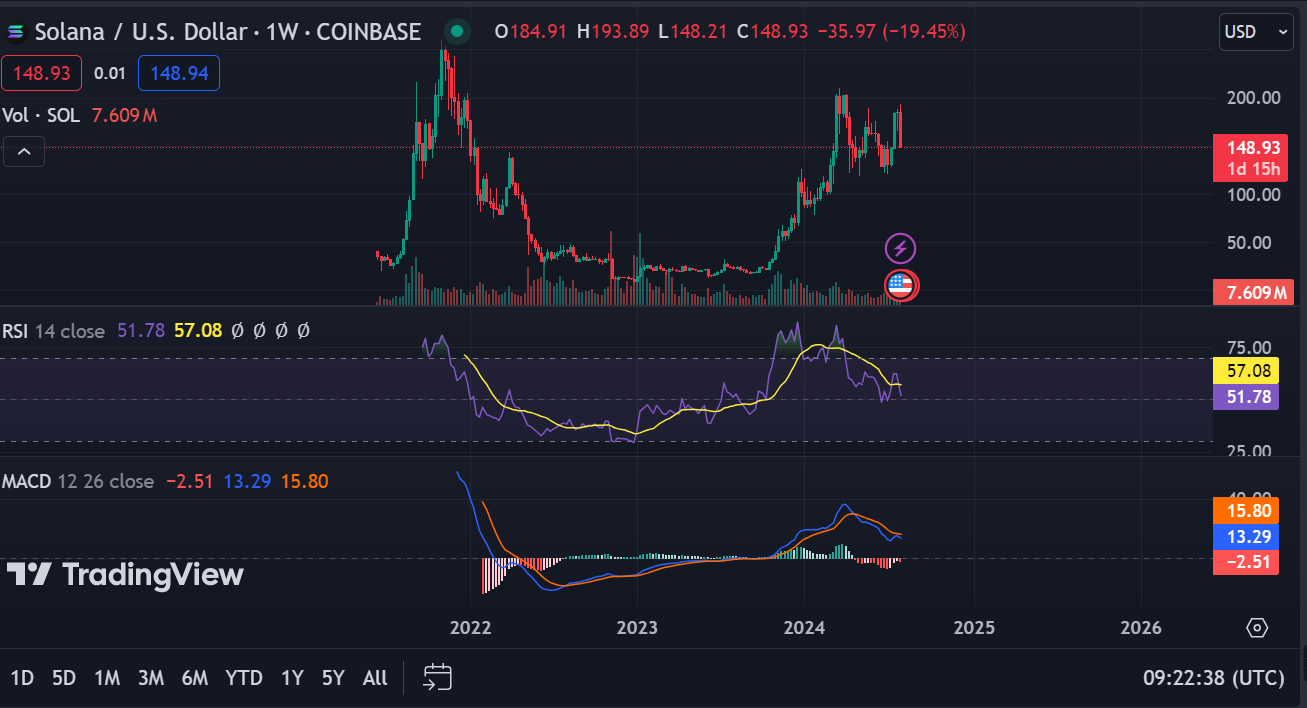
Solana’s 1-week RSI stands at 51.78, indicating a neutral market condition. The 1-week MACD, trading below the signal line, suggests potential short-term downward pressure on Solana’s price. Conversely, Ethereum’s 1-week RSI is at 47.04, which signals a slightly oversold condition. Ethereum’s MACD also trades below its signal line, reinforcing the bearish trend.