Dogecoin’s price has generally been in a downturn since April, although there have been periods of consolidation. As of press time, DOGE is valued at $0.098775, with a 24-hour trading volume of $1,003,627,972. DOGE is down 0.95% in the past 24 hours, with a market cap of $14,364,979,421 and a circulating supply of 145,432,036,384 DOGE coins.
Crypto Daily Trade Signals, an analyst, recently took to X about Dogecoin’s price movement, highlighting its current strength near key support levels. The post noted that $0.10 is a crucial area for DOGE, with the coin up about 15% from its recent bottom.
The chart displays two moving averages, likely the 20-day and 50-day EMAs. The shorter-term MA (orange) is below the longer-term MA (blue), indicating a bearish trend. Additionally, the price is below both MAs, signalling further bearish momentum.
PEPE and DOGE Display Bullish Signals, Analysts See ReversalsThe Bollinger Bands have tightened since July, suggesting decreased volatility in Dogecoin’s price. The recent price drop broke through the lower Bollinger Band, indicating oversold conditions. Trading volume has been relatively low, with occasional spikes. Notably, a substantial volume spike occurred during the recent price drop in early August.
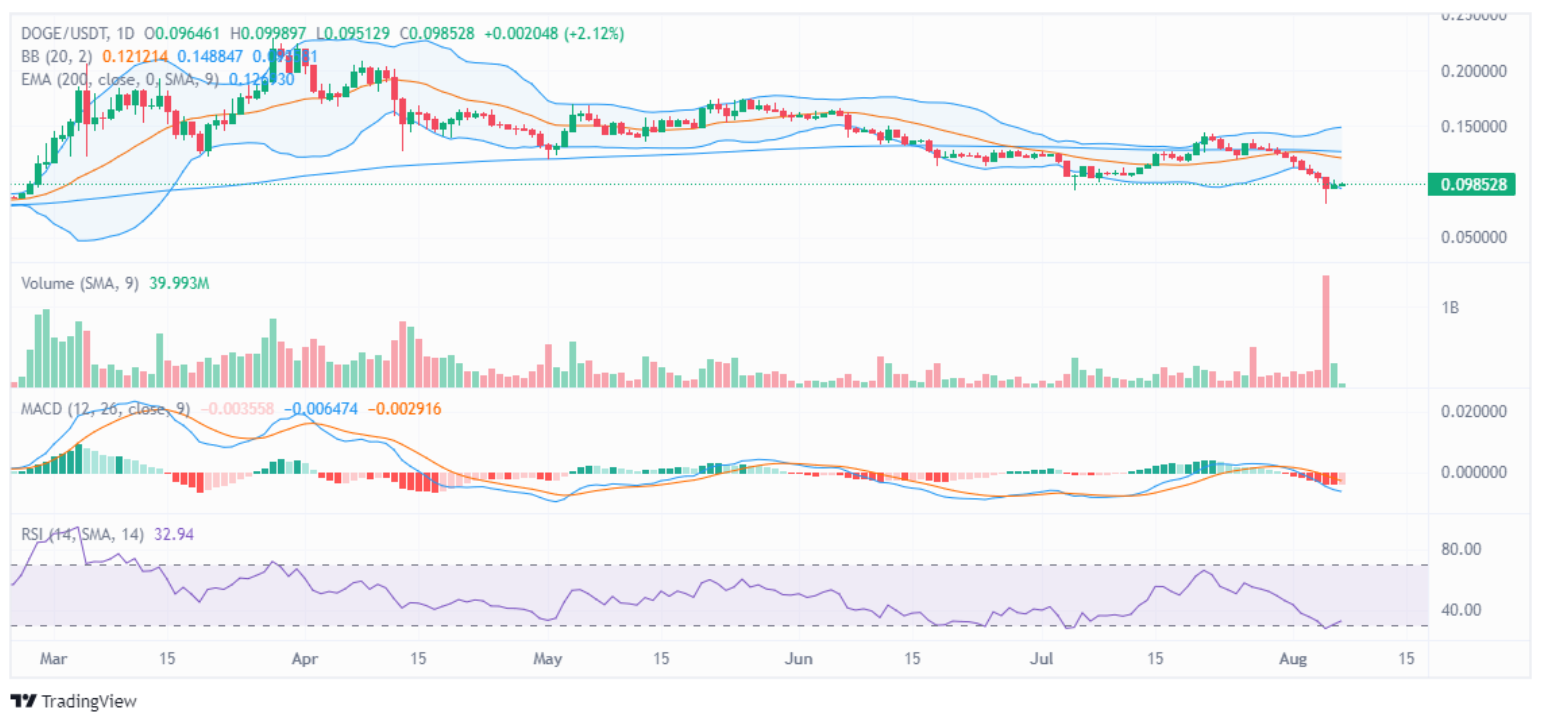
In Dogecoin’s 1-day chart, the MACD line is below the signal line and zero, showing bearish momentum. However, there’s slight bullish convergence forming, suggesting a potential trend reversal. The RSI is around 32.94, nearing oversold territory, and has been declining since mid-July, confirming the downward trend.
Moreover, a crypto promoter, Chain Explorer, highlighted the potential for a Dogecoin bull run based on historical chart analysis. According to the post, when key technical indicators, represented by red and green lines, intersect, it often signals a price surge. This intersection could indicate a shift in market sentiment and a possible upward momentum for DOGE, adding to the optimism among traders who are watching for signs of a trend reversal.