
Bitcoin (BTC) is at a pivotal moment in its trading journey, navigating a crucial decision point on the 4-hour chart against Tether (USDT) as per analysis by Crypto Rover, Crypto YouTuber.
The cryptocurrency, having experienced a downtrend, is currently in a phase of short-term recovery. This recovery is facing a critical juncture, presenting two potential scenarios that will significantly influence Bitcoin’s near-term direction.
Bitcoin’s price is testing a key resistance level at $58,000. This level has been a strong barrier in recent days, and its breakout could signal a bullish reversal. If Bitcoin manages to surpass this resistance, it might embark on an upward trajectory, potentially reaching $60,000 and even $64,000.
The $64,000 level, in particular, represents a major resistance point that could act as a strong hurdle for any further rally. Consequently, overcoming this resistance would likely attract additional buyers, pushing the price higher.
Conversely, the bearish scenario suggests a different outcome. If Bitcoin fails to break through the $58,000 resistance and starts to reverse, it could face downward pressure. In this case, the price might test lower support levels.
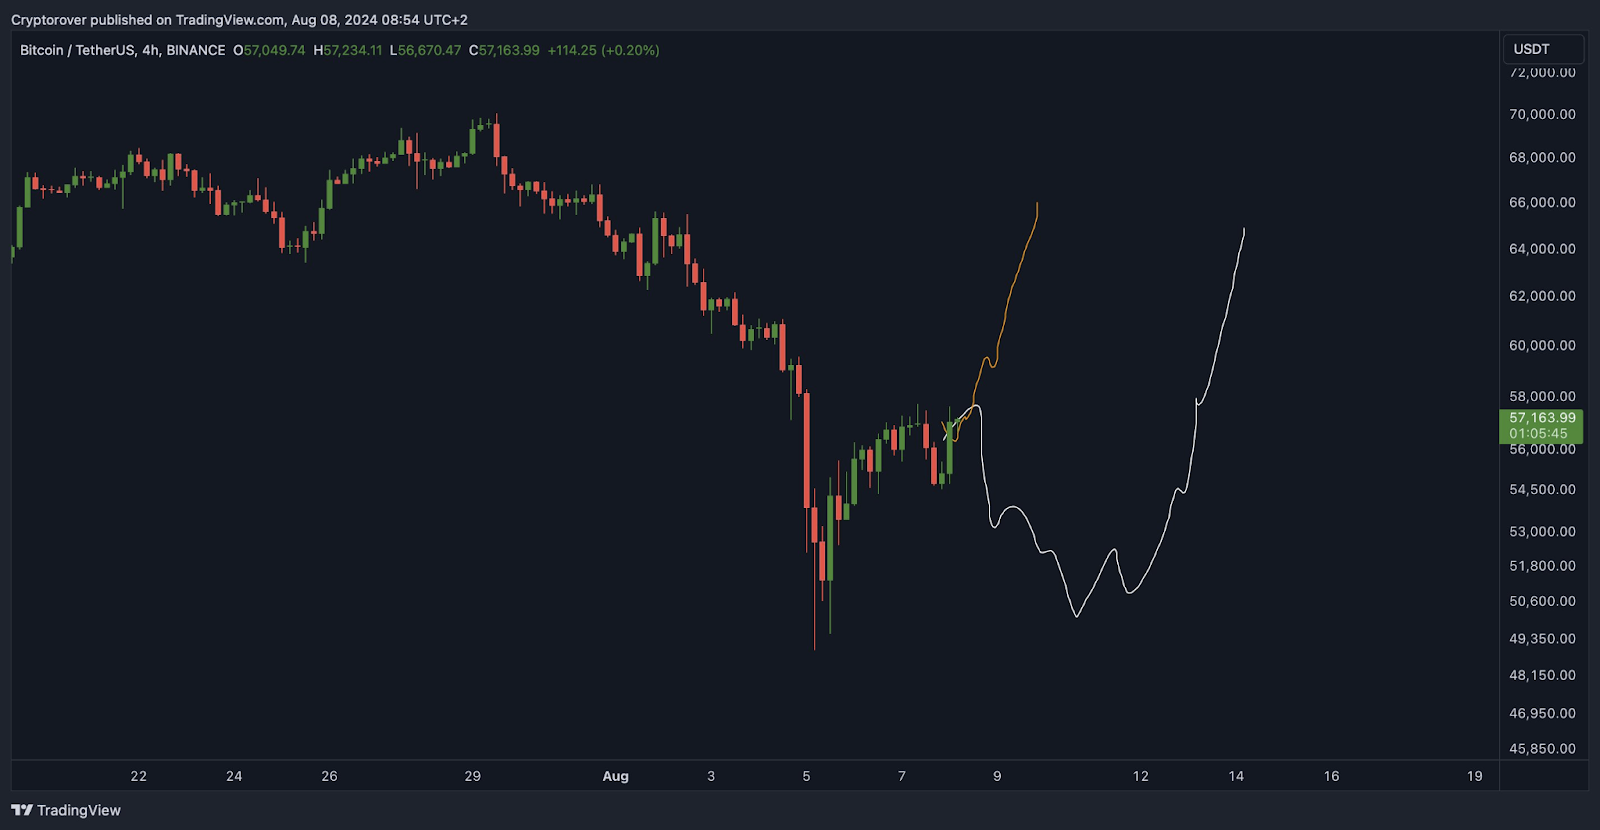
The immediate support level to watch is $56,000, which has previously served as a rebound zone. If Bitcoin cannot hold this level, it could move towards $54,500. A more significant support level to consider is $50,600, which may come into play if the correction deepens further.
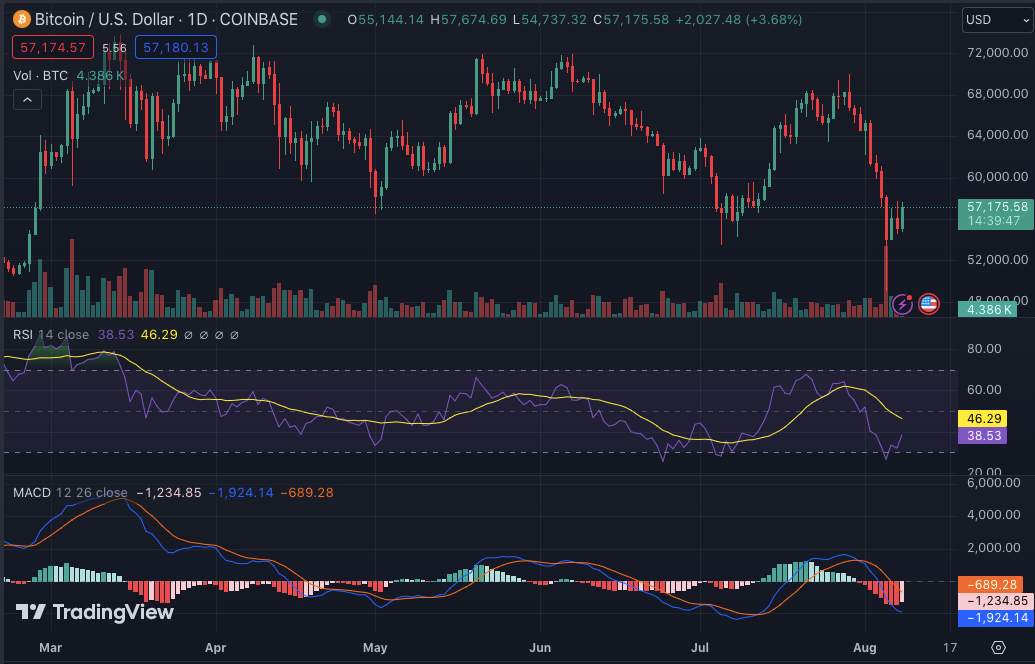
As at press time, Bitcoin’s live price stands at $57,280.24, showing a slight decline of 0.42% over the past 24 hours. The 1-day Relative Strength Index (RSI) reads 38.30, indicating that Bitcoin may be nearing oversold conditions.
This suggests that the cryptocurrency could be experiencing downward momentum, as reflected by the 1-day Moving Average Convergence Divergence (MACD), which is trading below the signal line. This MACD reading implies that there may be further downward pressure in the short term.