
Bitcoin’s price has recently entered a period of calm, but the market is closely watching for potential shifts. The pioneer crypto has seen a 4.90% drop in the past 24 hours, trading at $58,209.18 at press time. As noted by analyst Captain Faibik, the technical setup suggests that this week could be pivotal for Bitcoin.
Analyzing the daily chart reveals an ascending triangle pattern, which typically indicates a bullish continuation. This pattern features a horizontal resistance line coupled with a rising support line, suggesting that Bitcoin may be consolidating before a possible breakout.
Support levels are crucial in understanding Bitcoin’s short-term price action. The range between $50,000 and $53,000 has historically been a strong support zone. Bitcoin has repeatedly bounced back from this area, making it a significant point for potential trend reversals. Additionally, the $56,000 mark has served as an intermediate support level. The price has fallen to this level after previous peaks, underlining its importance in the current market structure.
Bitcoin’s $58K Resistance: Major Hurdle or Breakthrough Ahead?The $68,000 to $70,000 range represents a major resistance zone. Bitcoin has tested this level several times but has struggled to break through convincingly. This resistance zone is crucial, as a successful breakout above it could signal a new bullish phase. Furthermore, the $60,000 level has also acted as resistance in the past, where Bitcoin faced challenges before eventually surpassing it.
If Bitcoin manages to push above the $68,000 to $70,000 resistance level with significant volume, it could trigger a new bullish trend. This move might drive Bitcoin toward new all-time highs. Conversely, if Bitcoin fails to overcome this resistance, a bearish scenario could unfold. This might lead to a retest of lower support levels, possibly dropping back to $53,000 or even $50,000.
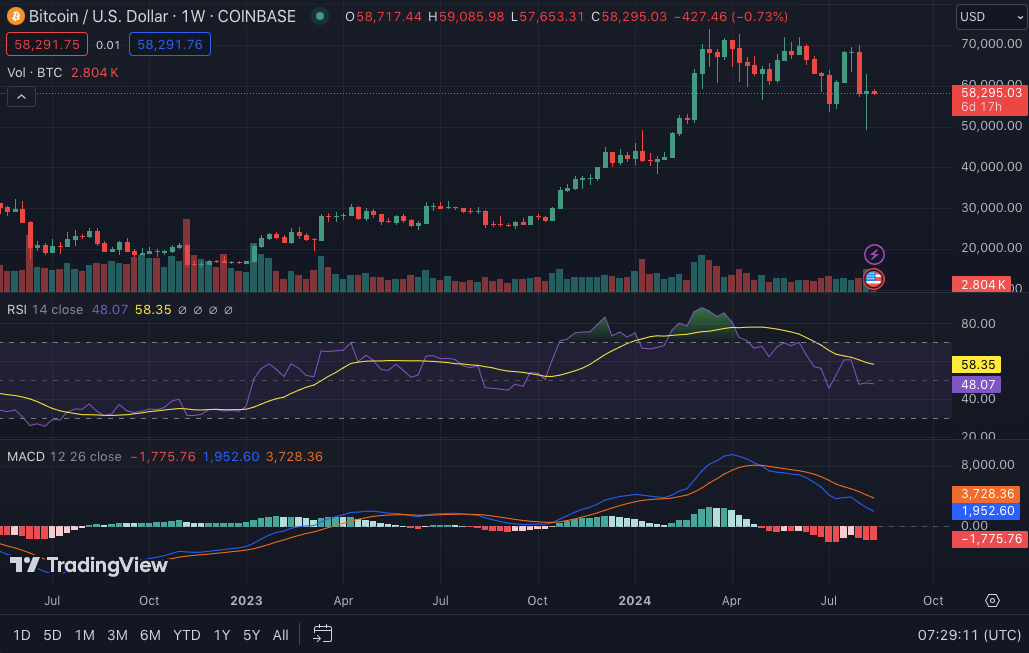
Looking on to the technical side, the weekly RSI stands at 47.35, suggesting that Bitcoin is neither overbought nor oversold. Additionally, the MACD is trading below the signal line, indicating a bearish trend in the short term.