
Bitcoin halvings have consistently marked pivotal moments in the cryptocurrency’s history. Each halving has triggered substantial price movements, often characterized by significant price surges followed by notable corrections. As noted by Elja, an analyst, the 2024 halving is no different, with Bitcoin experiencing a 30% correction post-halving. This pattern aligns with past trends and suggests potential future movements that traders should consider.
Historically, Bitcoin has exhibited dramatic price behavior following each halving event. After the 2012 halving, Bitcoin’s price surged by nearly 7,879.36% before encountering a correction. The 2016 halving saw a 2,321.09% increase, culminating in a price peak of $18,854. Similarly, the 2020 halving resulted in a 558.83% rise, peaking at $55,045 before a correction.
Following the 2024 halving, the price has corrected by 30%, a pattern consistent with past post-halving corrections. This suggests that Bitcoin might be in a consolidation phase, preparing for potential future movements. The chart indicates that Bitcoin could be poised for a significant breakout, particularly in the latter part of 2024.
The $32,000 level serves as a significant support zone, reflecting stability after the recent correction. A drop below this level could signal a deeper bearish phase, aligning with historical correction patterns. Additionally, the $20,000 to $22,000 range represents vital support from the 2017 bull run, crucial for long-term bullish momentum.
The $55,000 to $60,000 range marks a significant resistance area. Breaking through this zone could signal a continuation of the bull market and potential new all-time highs. Moreover, if Bitcoin surpasses this resistance, the $70,000 to $75,000 range may become the next target.
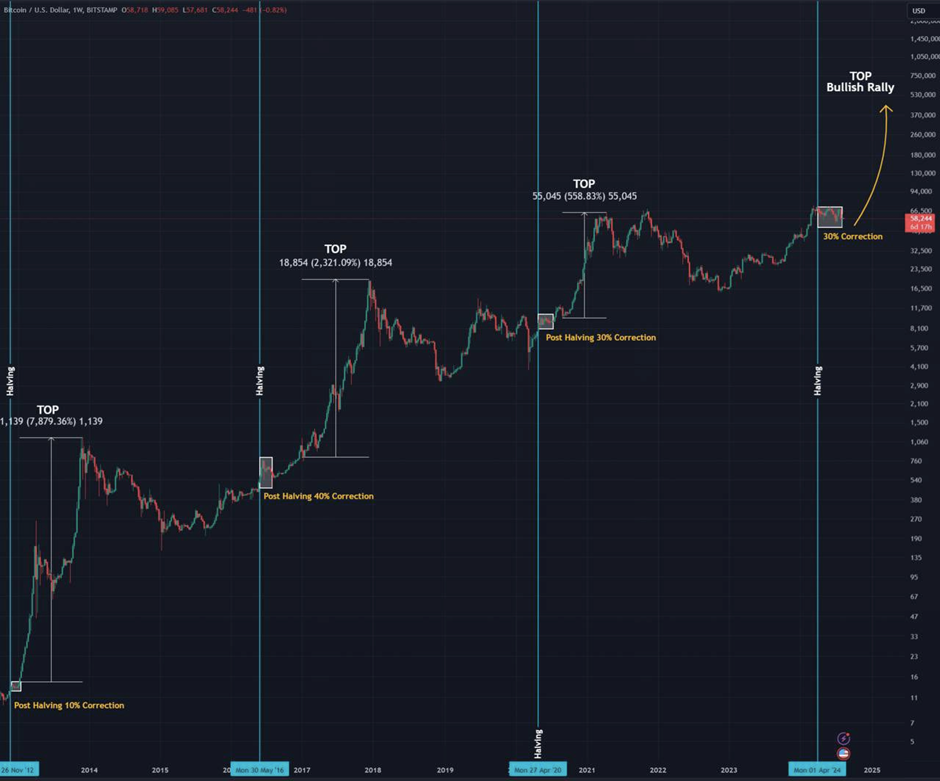
In a bullish scenario, Bitcoin might follow its historical post-halving patterns and experience a substantial rally. This could potentially lead to new all-time highs, with projections reaching between $100,000 and $300,000 in the long term. Conversely, if the correction deepens and breaks below critical support levels, Bitcoin could enter a prolonged bearish phase. This might involve retracing to lower levels before a significant rally resumes.
Bitcoin Whales Accumulate: Major Bull Market on the Horizon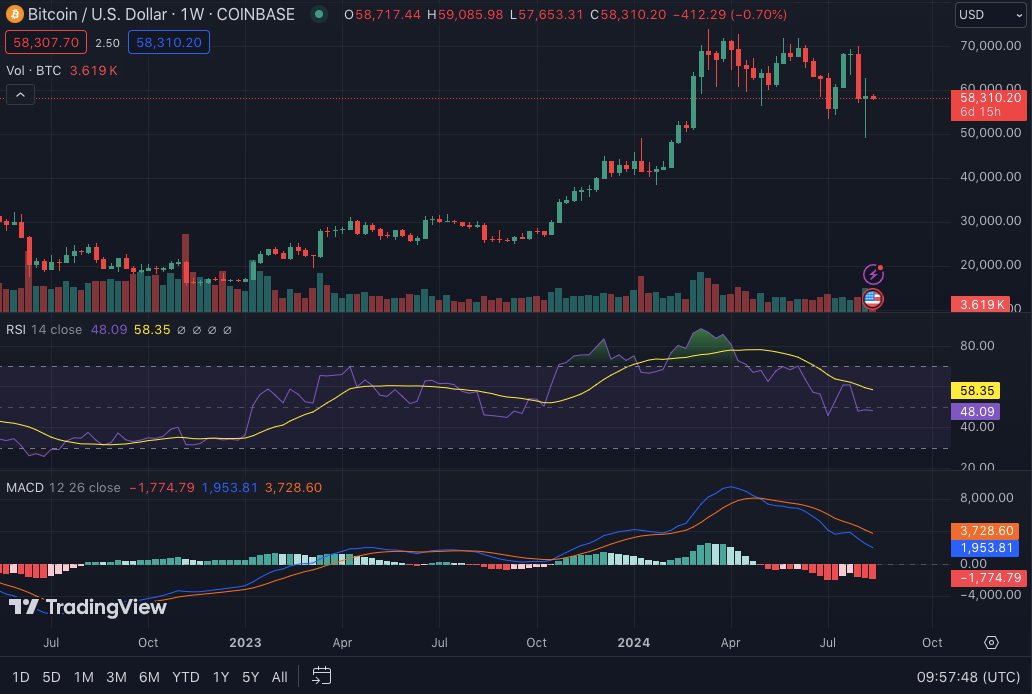
As at press time, Bitcoin is priced at $58,311.72, with a trading volume of $27,914,845,181. While the price shows a 24-hour decline of 4.95%, the 1-week RSI of 48.09 indicates a market neither overbought nor oversold. Additionally, the 1-week MACD trading below the signal line suggests short-term downward momentum.