
Shiba Inu (SHIB) is currently showing signs of a potential price reversal, which has caught the attention of traders and analysts alike. Recently, SHIB has demonstrated a pattern of higher lows on its chart, suggesting a possible shift in its price trend.
This technical development could signal the beginning of a trend reversal after a prolonged downtrend. While this offers a glimmer of hope for a bullish turnaround, it is crucial to remember that market conditions are subject to rapid changes, and this indicator alone does not guarantee a positive outcome.
Over the past 24 hours, SHIB’s price has been on a downward trajectory, falling from around $0.00001429 to the level of $0.0000137 at press time. The price represents a 4.12% decrease in value. Though SHIB has seen minor recoveries, the overall trend remains bearish. Despite this, the formation of a higher low might be the first sign of a trend change. Key support levels for SHIB include the range of $0.0000134 to $0.0000135, where the price recently rebounded. This area is crucial as it represents a short-term support zone.
If SHIB fails to maintain this level, the price might move lower, potentially testing the psychological support at $0.0000130. This level aligns with previous price actions and could act as the next significant support if the downtrend persists. On the resistance side, SHIB needs to overcome the $0.0000140 to $0.0000142 range to signal the start of a recovery. The price has previously tested this range but struggled to remain above it, indicating selling pressure. A breakthrough above this level could pave the way for a rally towards $0.0000145, a more substantial resistance area.
Shiba Inu Sees a Potential 354% Surge, Targets $0.000081The recent increase in trading volume by 38.67%, reaching $223.57 million in the last 24 hours, highlights a surge in market activity. This uptick could lead to higher volatility in the short term. A continued increase in volume might facilitate a breakout through resistance levels, while a decline could exacerbate the downward trend.
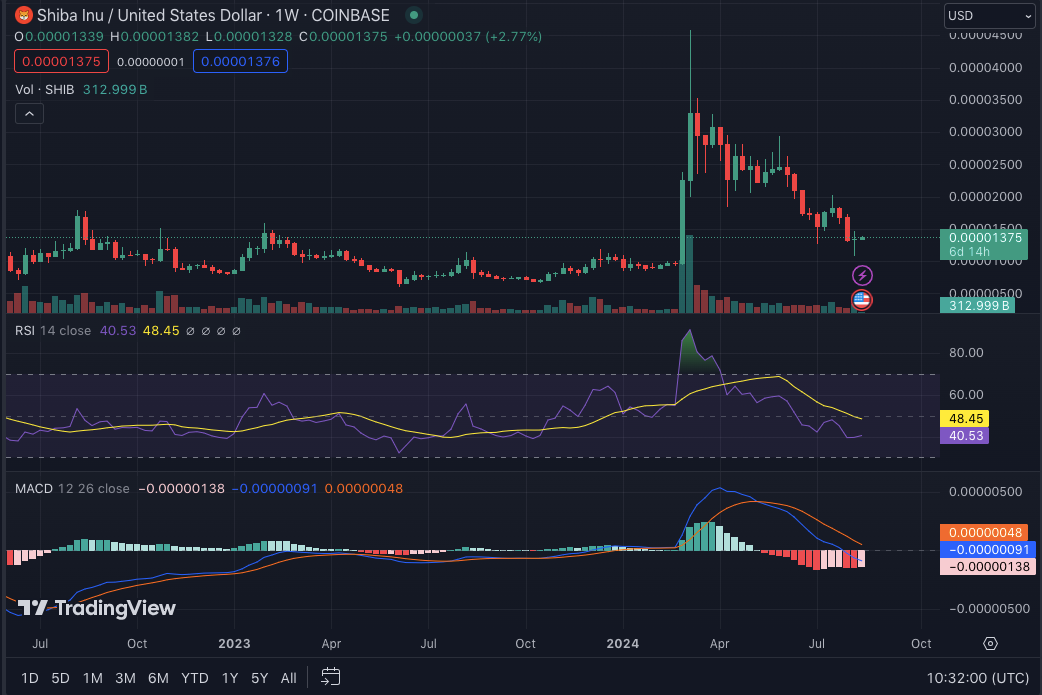
Analyzing technical indicators, the weekly RSI for SHIB stands at 40.53, placing it in the oversold territory. This condition might suggest a buying opportunity for traders looking to enter the market. Conversely, the MACD is below the signal line, indicating potential further downward momentum in the near term.