
- Toncoin’s breakout from a bullish pennant signals strong potential, aiming for a $7.30 target.
- Support at $6.20, and resistance turned support at $6.60 remain crucial for Toncoin’s bullish trend continuation.
- With a 6.12% gain and neutral RSI, Toncoin may retest $6.60 before targeting $7.30
Toncoin (TON) has recently demonstrated a compelling bullish pattern on its 4-hour chart, signalling the potential for further gains. As per Clifton Fx, an analyst, the formation of a bullish pennant has been confirmed, indicating a strong continuation of the upward trend. This technical setup follows a notable price surge, creating a pattern traders often watch for continued momentum.
The bullish pennant pattern begins with a significant price increase, known as the flagpole. This surge is followed by a consolidation phase, during which the price narrows into a pennant shape. Such a pattern typically signals that the previous uptrend is likely to continue once the consolidation period concludes. Recently, Toncoin broke through the upper trendline of this pennant formation, confirming the breakout and suggesting that the bullish momentum remains strong.
The lower trendline of the pennant, around the $6.20 mark, has proven to be a significant support level. This support was tested multiple times during the consolidation phase, reinforcing its importance. Conversely, the upper trendline, previously acting as resistance at about $6.600, has now been surpassed. If the price retests this area, this level may turn into a support zone.
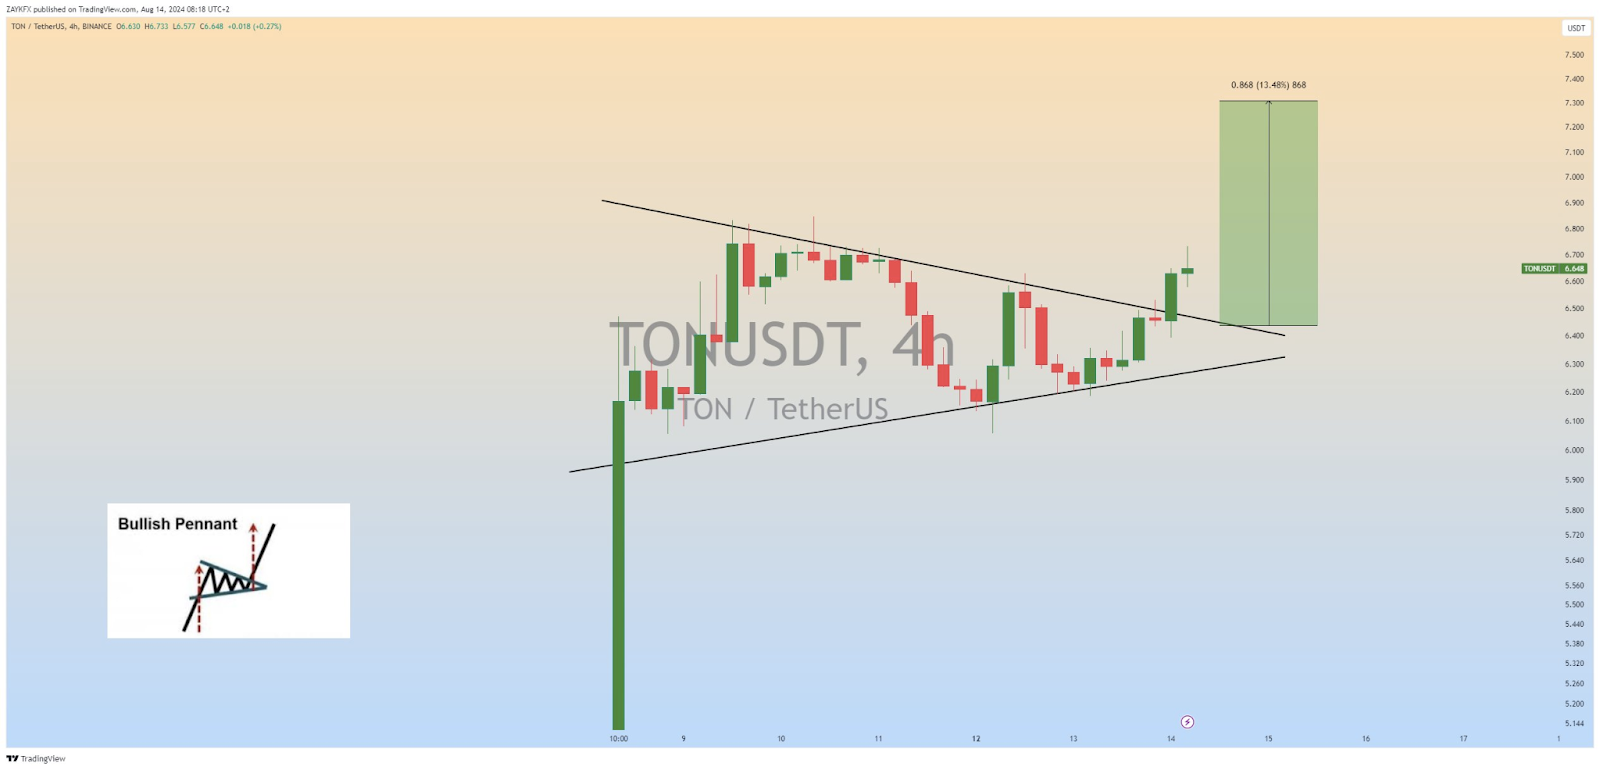
The projected price target for Toncoin, based on the height of the pennant’s flagpole, is approximately $7.300. This target represents a potential 13.48% increase from the breakout point.
Toncoin Faces Buying Pressure, Eyes Potential Drop Below $6Toncoin, the Telegram-based altcoin, has seen a notable surge over the past 24 hours. At the time of reporting, the cryptocurrency is valued at $6.74, marking an increase of 6%. According to CoinMarketCap data, the price fluctuated between a low of $6.25 and a peak of $6.77 during the day. The recent surge marks a continuation of its upward trend, reflecting increased trading activity and investor interest in the platform.
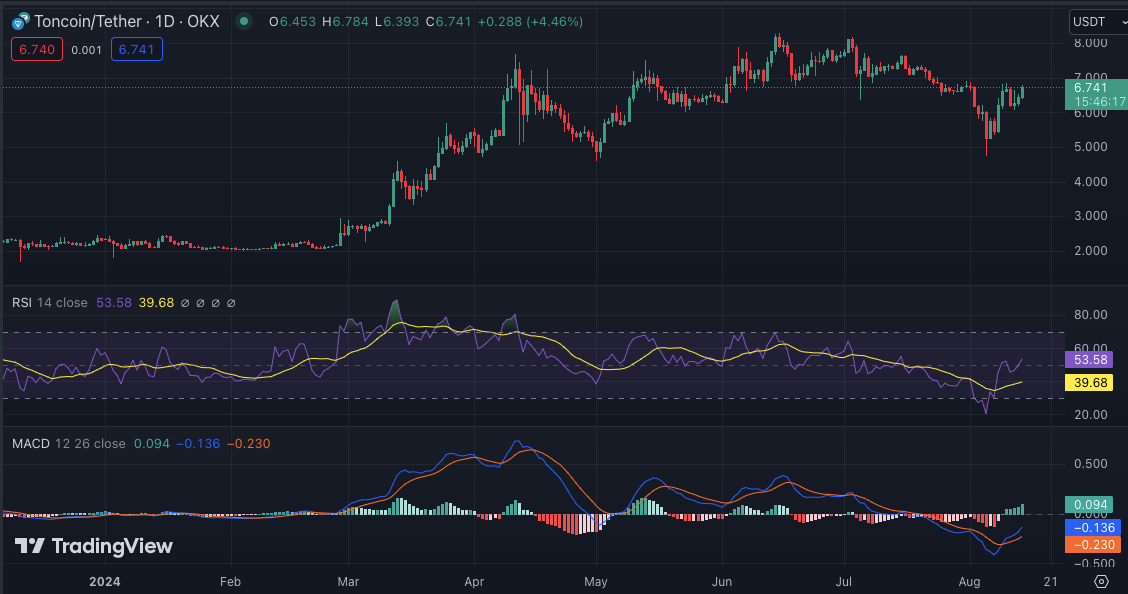
The 1-day Relative Strength Index (RSI) is at 53.58, indicating a neutral trading sentiment. This neutral RSI suggests that the cryptocurrency is neither overbought nor oversold. Moreover, the daily Moving Average Convergence Divergence (MACD) trades above its signal line, offering a potential bullish signal.