XRP’s price action is currently set against a backdrop of significant technical indicators, suggesting a potential breakout or downturn. The token’s symmetrical triangle pattern hints at a major breakout or downturn soon. Bollinger Bands contraction suggests a significant price move could be imminent. XRP’s price is near crucial levels as breakout could lead to gains, breakdown to losses.
Price action is currently set against a backdrop of significant technical indicators, suggesting a potential breakout or downturn as per XRP CAPTAIN analysis. The XRP/USD weekly chart highlights a symmetrical triangle pattern, a classic formation known for its potential to signal major price moves.
As XRP approaches the apex of this triangle, traders are keenly watching for signs of a breakout. The pattern is characterized by converging trendlines: an upper resistance line sloping downward and a lower support line sloping upward. This convergence indicates a narrowing of price movement, which typically precedes a decisive breakout.
The chart suggests two primary scenarios: a bullish breakout or a bearish breakdown. For a bullish outcome, XRP would need to break above the upper trendline. This resistance level has historically marked price peaks, and overcoming it could pave the way for significant gains.

If the price surmounts this resistance, potential targets could include previous high points at $0.90, $1.50, and even $2.50. Conversely, a bearish scenario could emerge if XRP falls below the lower support trendline. Such a move might lead the price to test previous support levels around $0.30 or lower.
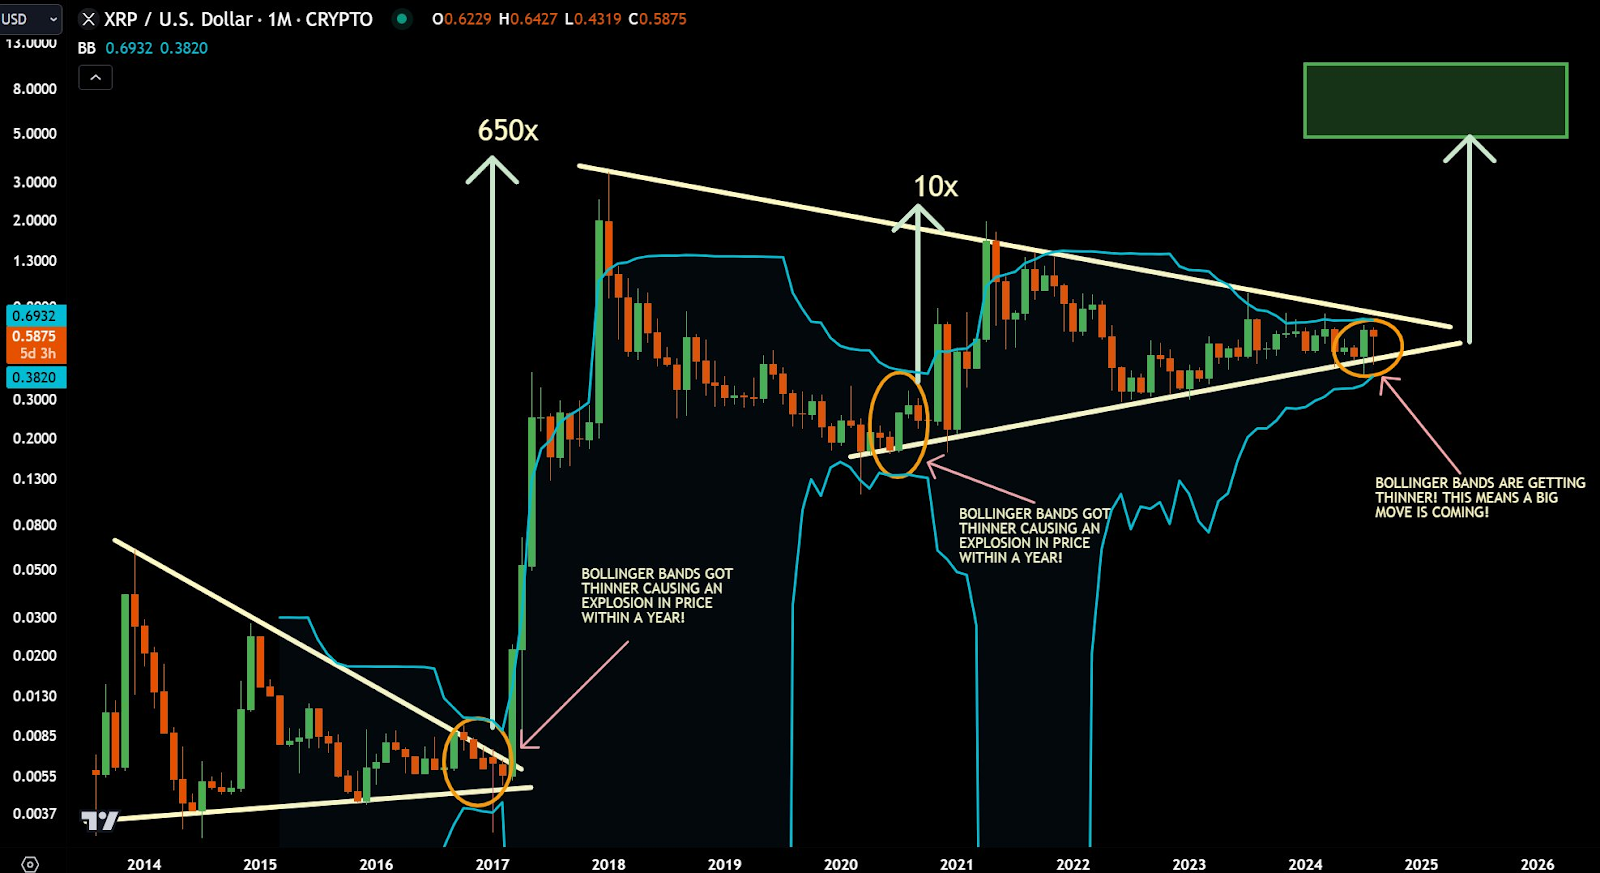
The Bollinger Bands on the monthly XRP/USD chart provide further insight into potential price movements. Bollinger Bands measure market volatility and typically contract before a significant price move.
Analyzing XRP’s Path: Can the $0.6500 Resistance Ignite a Major Breakout?The recent contraction of these bands on the XRP chart is reminiscent of past periods before explosive price increases. Further historical data from Jaydee, an analyst, shows that similar contractions preceded massive rallies: a 650x increase in 2017 and a 10x gain in 2020-2021.
The Bollinger Bands are once again contracting, signaling that a major price move could be on the horizon. If the bands expand following a breakout above the upper trendline, XRP might experience a substantial upward surge.
The chart’s historical performance supports this possibility, hinting at a potential price surge well beyond previous all-time highs. However, if XRP fails to breach the upper trendline and instead drops below the lower trendline, it could invalidate the bullish outlook and suggest a bearish trend. As at press time, XRP is trading at $0.589867, with a 24-hour trading volume of approximately $1.09 billion, reflecting a 1.11% decline in the last day.