
Bitcoin whales, defined as entities holding at least 100 BTC, are making notable moves in the cryptocurrency market. Despite the recent disappointments faced by retail traders, the number of these large holders has surged.
As highlighted by Santiment, a top analytic firm, a net gain of 283 new whale wallets has been recorded over the past month, marking a 1.83% increase. This brings the total number of whale wallets to 16,120, a figure that has now reached a 17-month high.
This rise in whale wallets highlights a shift in market dynamics. The accumulation of Bitcoin by large holders suggests growing confidence among institutional and high-net-worth investors. Moreover, this trend coincides with several bullish technical indicators on Bitcoin’s weekly chart.
Further analysis by Kevin Svenson suggests that both the Relative Strength Index (RSI) and the Moving Average Convergence Divergence (MACD) show bullish divergences. This indicates potential upward momentum in Bitcoin’s price over the coming weeks.
Despite the bullish signals, Bitcoin’s price has been hovering around $59,255, reflecting only a 0.74% increase in the last 24 hours. Additionally, the one-day RSI, which stands at 45.40, indicates a neutral market position. The MACD, trading below the signal line, suggests that downward pressure could persist in the short term.
As per DefiLlama data, Bitcoin’s Total Value Locked (TVL) stands at $525.56 million, with 24-hour fees amounting to $486,402. Within the last 24 hours, there have been 826,297 active addresses, underscoring the continued engagement of Bitcoin users. Furthermore, Bitcoin’s trading volume remains significant at $30.36 billion, signaling robust market activity. This reflects the network’s growing utility and the sustained interest in its ecosystem.
Bitcoin Whale Moves $472M, Amid Recent Price Dip below $58KMoreover, the BTC Long/Short Ratio chart reveals an intriguing pattern. This chart shows the taker’s buy/sell volume over several days, fluctuating between long and short positions. The ratio oscillates between 0.80 and 1.15, indicating alternating periods of dominance between buyers and sellers.
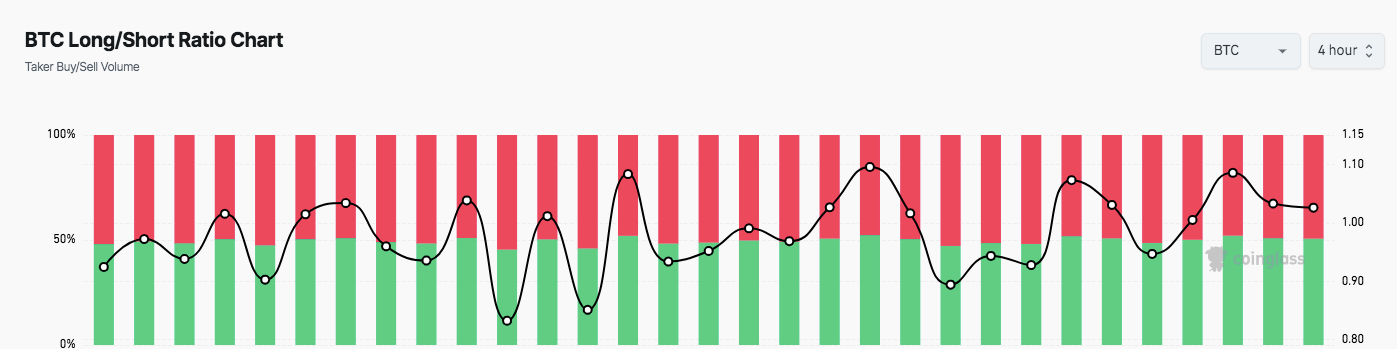
The ratio tends to hover around 1.00, suggesting a balance between long and short positions over time. However, the occasional peaks and troughs in the ratio highlight short-term shifts in market sentiment