
Bitcoin price has recently rebounded, showing signs of recovery after a period of stagnation. Despite this positive shift, the cryptocurrency market remains cautious, with many leading currencies struggling to sustain a bullish momentum. Bitcoin maintains a steady position, holding above the $55,000 support level, signaling optimism among investors.
Crypto analyst Jelle recently highlighted on X post that Bitcoin displays a significant three-day bullish divergence. This pattern has emerged just as Bitcoin reached the low end of its range. While these are still early observations, a green close on the current candle would confirm this trend.
#Bitcoin is forming a major 3-day bullish divergence, right around the range lows!
— Jelle (@CryptoJelleNL) September 9, 2024
Still early days, but it locks in if the current candle closes in the green.
👀 pic.twitter.com/NIj6SlfUJv
Over the past 24 hours, the Bitcoin price has witnessed a significant uptick, marking an increase of 1.43% to reach $55,203 at press time. Notably, the trading volume surged by over 51%, totaling around $24.31 billion. The price chart exhibits a noticeable recovery from a dip to $54,470, followed by a steady climb, showcasing robust trading activity and investor interest.
In another X post, cryptocurrency expert Michaël van de Poppe unveiled a new chart that maps potential market movements. He pinpointed two critical thresholds that could indicate where the market may stabilize.
#Bitcoin made a significant bounce and reached $54,800-55,200.
— Michaël van de Poppe (@CryptoMichNL) September 9, 2024
I don't know whether we're continuing that pace in one go.
It's CPI week, another big data point.
Expecting liquidity to be taken and then <$53K before we go back up.
Invalidated if break above $56K -> positive. pic.twitter.com/48Pv0lCRFc
The recent chart captures a significant rally in Bitcoin, reaching between $54,800 and $55,200. Van de Poppe remains cautious, noting the uncertainty of maintaining this upward trajectory. He emphasized the importance of the upcoming CPI week, a pivotal time for observing market data. His analysis suggests possible fluctuations with Bitcoin potentially dipping below $53,000 before climbing again. Key resistance, if surpassed at $56,000, would signal a positive shift, according to van de Poppe.
Bitcoin Price Forms Bullish Pattern Amid Market TurbulenceThe analyst forecasts a market response where key support levels at $55,189 and $53,626 will be crucial if the downtrend resumes. Van de Poppe advises traders to prepare for potential bottoming at these levels, stressing the need for a strategic approach amidst uncertain market conditions.
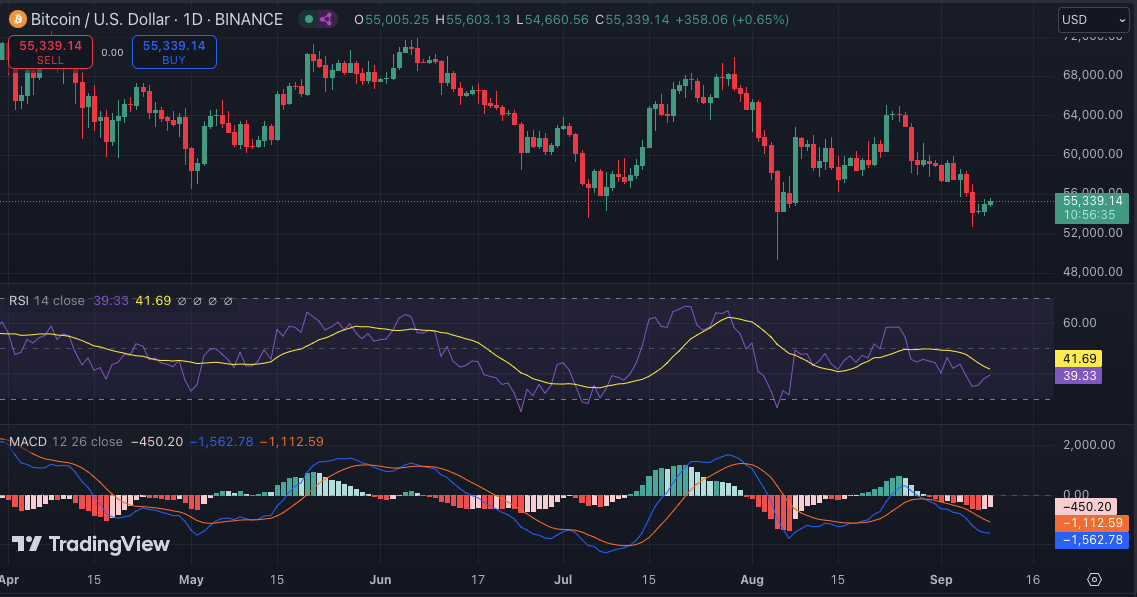
The daily technical indicators for Bitcoin reveal a nuanced picture of market sentiment and potential trends. The Relative Strength Index (RSI) currently sits at 39. This indicates that Bitcoin is neither overbought nor oversold, suggesting a relatively balanced market. The Moving Average Convergence Divergence (MACD) shows the signal line slightly above the MACD line, indicating bearish momentum.
In summary, while Bitcoin has shown a promising three-day bullish divergence, caution remains crucial as the market approaches key support levels and the upcoming CPI week. Analysts like Jelle and van de Poppe emphasize the importance of these levels, particularly $55,189 and $53,626, as potential points for stabilization.