
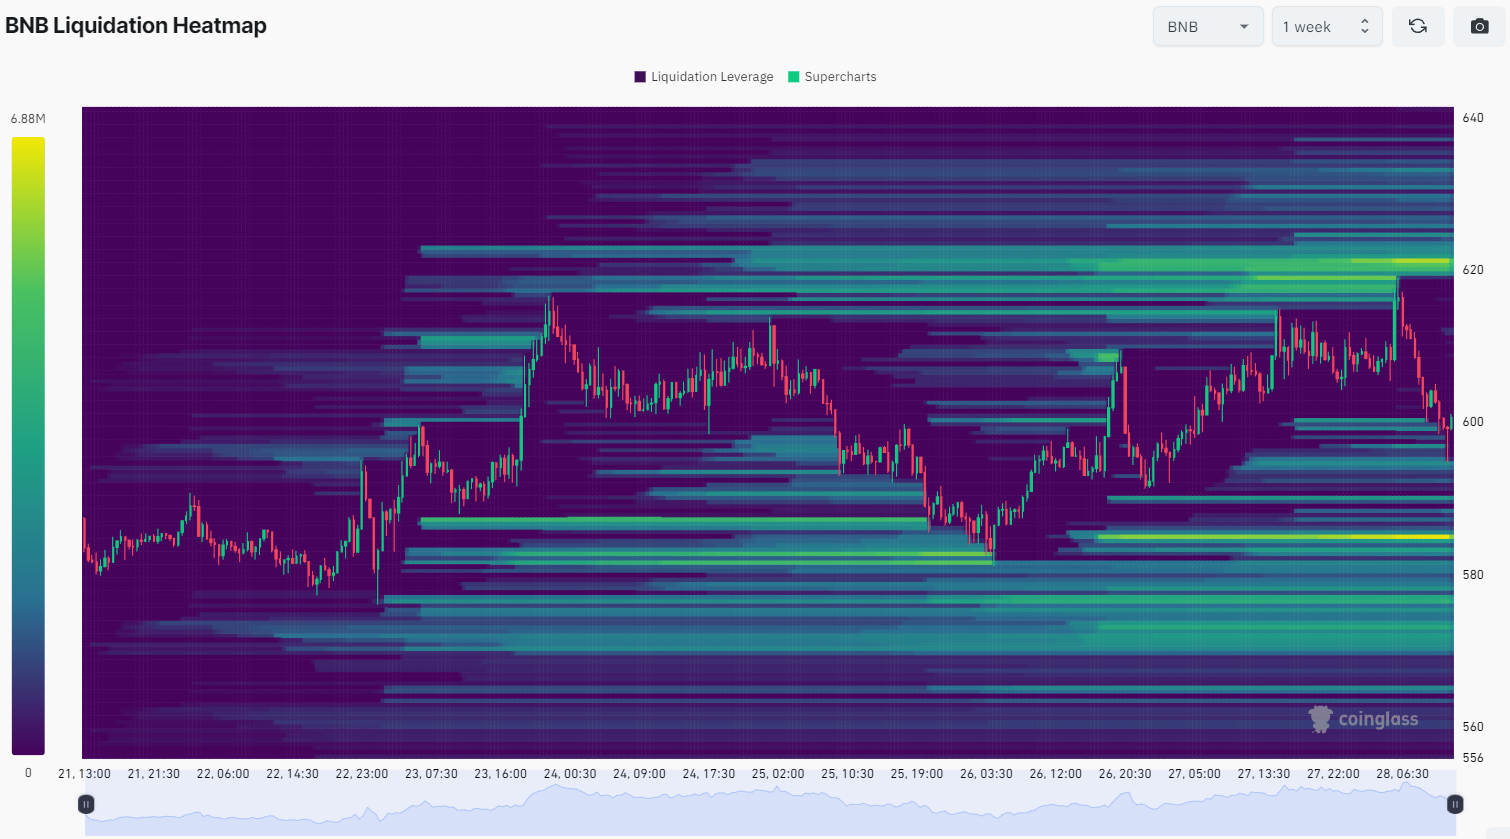
BNB trades between two key liquidity zones, showing potential for significant price movement. A recent liquidation heatmap highlights critical leverage levels and market behavior over the past week. At the time of press, BNB was priced at $600, reflecting a 1.3% decline in the last 24 hours and a 2.4% gain in the past week.
Liquidity Zones
The heatmap shows two main liquidity zones between $585 and $625. These zones are marked by heavy liquidation leverage. The zone above $595 shows a large cluster of liquidations. This indicates strong market interest, making it a key support level. The price may move toward this level as traders position themselves to trigger these liquidations.
The upper zone near $620 shows substantial liquidation activity as well. This level serves as a significant resistance point. Traders are heavily positioned here, expecting the price to reach or surpass this level. The high concentration of liquidations at these points suggests these levels are critical for market participants.
Price Movement Possibilities
The BNB’s price fluctuates between these liquidity zones, staying mostly range-bound. The concentration of liquidations near these key levels makes a breakout in either direction possible. Due to the heavy liquidation pressure there, the price might first test the $600 level. Markets often move towards areas with significant liquidation activity, making a downward move likely.
If the market momentum turns bullish, the price could spike toward the $625 level. This would trigger the liquidations positioned at this resistance point. Following this move, increased selling pressure might drive the price back down toward $585. The market’s next move will depend on how these levels react.
BNB’s Bearish Momentum Builds as $600 Resistance LoomsLikely Scenarios for Price Movement
The heatmap points to two potential scenarios. The first scenario suggests a downward move toward the $585 level. If this occurs, it could trigger a significant number of liquidations. Afterward, a bounce or reversal may follow, pushing the price higher.
The second scenario starts with a first upward movement toward $625. This could begin the liquidations at this resistance zone. Following the absorption of this liquidity, the market may experience selling pressure and undergo a downward correction. The continuous struggle among these liquidity zones will direct further price movements. A strong reaction at $585 could inspire increasing momentum. However, difficulty in rising beyond $625 might also force the price down once more. The heat map offers a clear perspective on the present difficulties and possible paths for market development.