


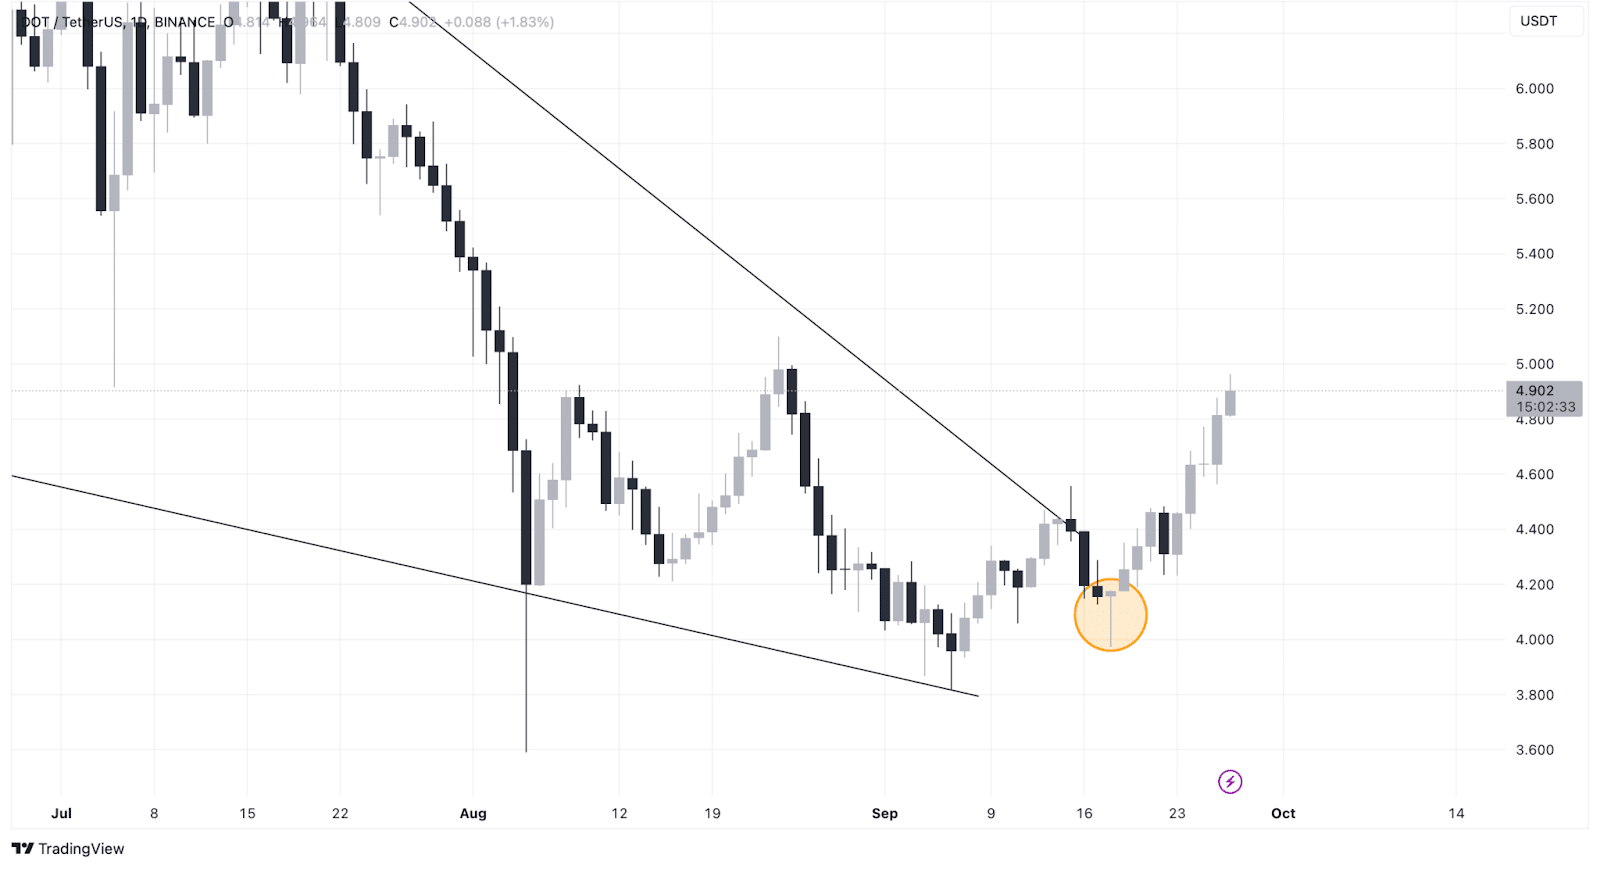
- Polkadot (DOT) posts a 14.3% gain in two weeks, showing signs of steady recovery.
- Analyst Daniel Ramsey predicts DOT’s price targets at $13.95, $26.60, and $47.80.
- DOT’s technical breakout from a falling wedge signals the potential for continued gains.
Polkadot (DOT) has been slowly but steadily climbing the price appreciation ladder. Over the last two weeks, DOT has appreciated by 14.3%. Interestingly, in the previous week alone, it rose by 11.03%. Other technical analysis tools support this, suggesting that this cryptocurrency may soon experience an even larger rally.
Analyst’s Bullish Targets
On Thursday, crypto analyst Daniel Ramsey shared his thoughts about DOT’s current situation. Ramsey noted that DOT has been moving in a falling wedge pattern and is now attempting to bounce off the important support level. He believes that this price action indicates that DOT has found a local bottom and has established intermediate and long-term targets of $13.95, $26.60, and $47.80.
#DOT/USDT$DOT completed the falling wedge and now bouncing off the major support zone👀
— Daniel Ramsey (@ramseycrypto) September 26, 2024
Bottom is in imo🚀
✔️Mid-Term Target: 13.950$
✔️Long-Term Target: 26.600$
✔️Long-Term Target: 47.800$ pic.twitter.com/BzG16NuxQ7
In technical analysis, a falling wedge pattern is a bullish formation that is formed when the price action is contracting in a bearish trend and the price breaks out. DOT has recently escaped this pattern, which means that the upward movement may continue, and experts believe that the next significant price level for DOT may be above $11. This level would also support the bullish trend if it is reached.
Hammer Candlestick Signal
Another bullish signal that appeared was the formation of a hammer candlestick pattern on the daily DOT chart after the decline. This pattern indicates that buyers are gradually beginning to take charge, contrary to what we have witnessed over the past few days. The tendency to develop the pattern and the breakout from the falling wedge will also affect further evolution in the same direction.
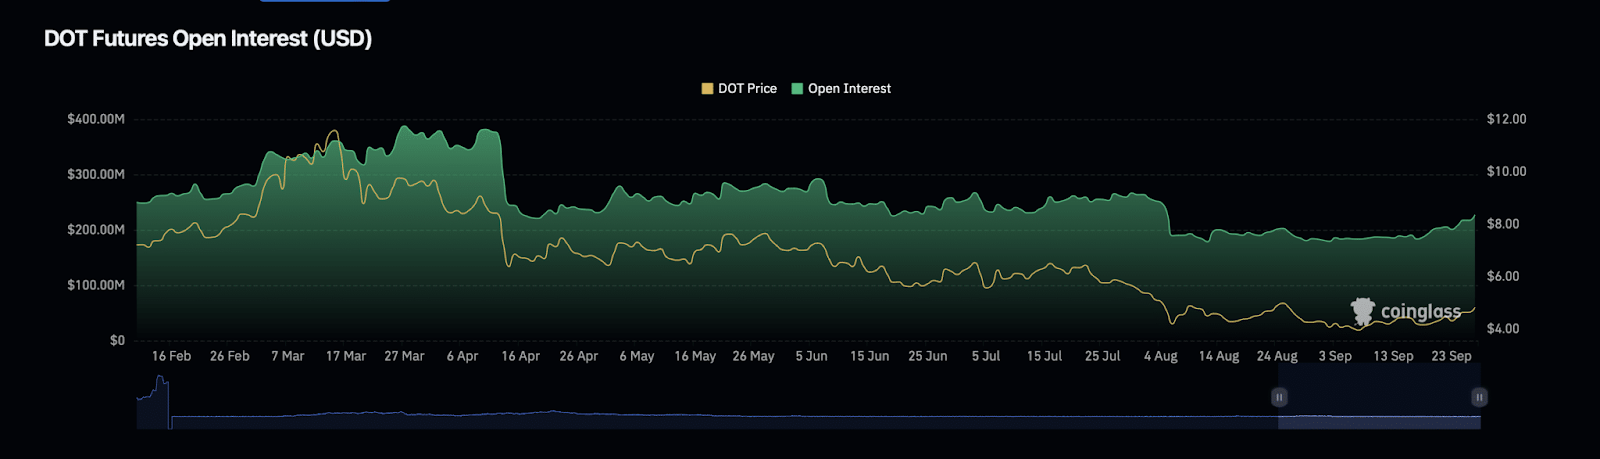
According to Coinglass, DOT’s Open Interest, a measure of open derivative contracts, has increased by 3.20% to $233.03 million. This increase can be attributed to enhanced market trading and traders’ increased interest in DOT.
Volume Decline Warning
At the same time, the DOT’s Open Interest volume has decreased by 15.16%, which means that trading has been low. This may be attributed to the fact that investors are in the middle of the road. It also implies that the trend of Open Interest differs from the volume, which tells traders to focus on market sentiment.
Polkadot Signals Bullish Wave After Falling Wedge Breakout, MKR Eyes $4KThe Relative Strength Index (RSI) is at 68, close to the overbought level of 70. This means that DOT could continue to rise without the risk of a sharp price drop. Given these bullish signals, DOT is ready for more price appreciation soon.


