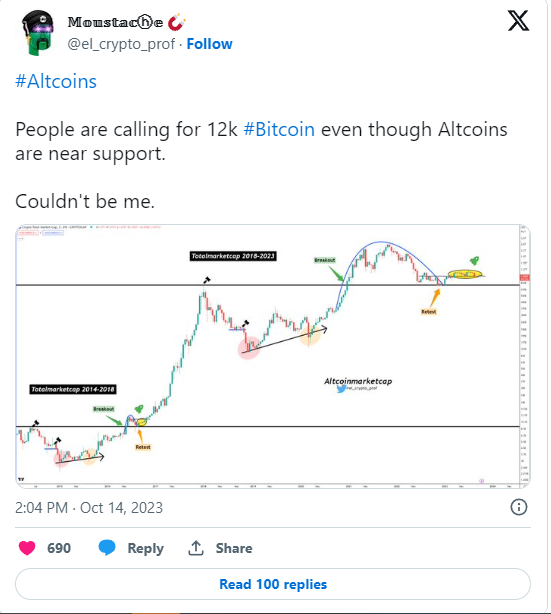
- Altcoin resilience contrasts forecasts of Bitcoin’s downturn to 12k, suggesting potential market uptrends.
- Patterns from 2014-2023 hint at significant market trends.
- Despite crypto’s volatility, patterns from 2014-2023 offer clues about future market directions and investment strategies.
Predicting market movements in the cryptocurrency sphere is often challenging. However, recent charts hint at patterns worth noting. While some forecast a downturn for Bitcoin to 12k, altcoins’ market behavior tells a different story. The total market cap data from 2014 to 2018 shows evidence of a decisive breakout, followed by a retest. This trend is also mirrored in the 2018-2023 chart. Understanding these patterns could offer valuable insights into upcoming market trends.
Crypto analyst, known on X as El_crypto_prof, recently spotlighted these patterns. In addition to these findings, he stressed the resilience of altcoins, which remain steadfast near their support levels despite the bearish sentiments towards Bitcoin. In finance, these support levels are pivotal as they suggest the price level where a cryptocurrency might find increased buying interest. If altcoins maintain their positions near these levels, it could signal an upcoming bullish phase. BTC’s current price is $26,867.06.

Yet, caution is always advised. While these patterns can suggest potential trends, the crypto market’s inherent volatility cannot be ignored. External influences, economic changes, and significant global events can significantly sway prices.
Meanwhile, Dogecoin price is $0.059283, reflecting a 1.14% growth, while Litecoin (LTC) is at $61.61, showing a 0.40% increase. XRP has decreased by 0.54% and is now at $0.479747. Outshining many, Solana (SOL) recorded a commendable 3.59% surge, pushing its price to $22.12 in the last 24 hours. Eth’s price is $1542.36.
As there’s chatter about Bitcoin possibly descending to 12k, the altcoin market showcases remarkable resilience. Investors and market watchers would keep a close eye on these support levels, as they could offer precious clues about the overall market trajectory.


